. 2005 Jan;79(1):458-71.
doi: 10.1128/JVI.79.1.458-471.2005.

R5 human immunodeficiency virus type 1 infection of fetal thymic organ culture induces cytokine and CCR5 expression

Affiliations

R5 human immunodeficiency virus type 1 infection of fetal thymic organ culture induces cytokine and CCR5 expression

Shailesh K Choudhary et al. J Virol. 2005 Jan.

Abstract

Late-stage CCR5 tropic human immunodeficiency virus type 1 (HIV-1) isolates (R5 HIV-1) can deplete nearly all CD4+ thymocytes from human thymus/liver grafts, despite the fact that fewer than 5% of these cells express CCR5. To resolve this paradox, we studied the replication and cytopathic effects (CPE) of late-stage R5 HIV-1 biological clones from two progressors and two long-term nonprogressors (LTNP) in fetal thymic organ culture (FTOC) with and without added cytokines. We found that R5 HIV-1 clones from progressors but not LTNP were cytopathic in untreated FTOC. Moreover, R5 HIV-1 clones from progressors replicated to higher levels than LTNP-derived R5 HIV-1 clones in this system. In contrast, when FTOC was maintained in the presence of interleukin 2 (IL-2), IL-4, and IL-7, both progressor and LTNP clones exhibited similar replication and CPE, which were equal to or greater than the levels achieved by progressor-derived R5 HIV-1 clones in untreated FTOC. This finding was likely due to IL-2-induced CCR5 expression on CD4+ thymocytes in FTOC. R5 HIV-1 clones showed greater pathogenesis for CCR5+ cells but also showed evidence of CPE on CCR5- cells. Furthermore, infection of FTOC by R5 HIV-1 induced IL-10 and transforming growth factor beta (TGF-beta) expression. Both IL-10 and TGF-beta in turn induced CCR5 expression in FTOC. Induction of CCR5 expression via cytokine induction by R5 HIV-1 infection of CCR5+ thymocytes likely permitted further viral replication in newly CCR5+ thymocytes. CCR5 expression, therefore, is a key determinant of pathogenesis of R5 HIV-1 in FTOC.


Figures
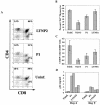
FIG. 1.
FIG. 1.
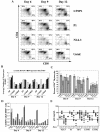
R5 HIV-1 progressor clone depletes CD4+ thymocytes in untreated FTOC. FTOC was prepared and maintained without added cytokines, as described in Materials and Methods, and was then infected with the X4 HIV-1 molecular clone NL4-3 (n = 4), R5 HIV-1 progressor clone P1 (n = 6), R5 HIV-1 long-term nonprogressor clone LTNP2 (n = 6), or was not infected (n = 6). NL4-3 was used in two experiments done in duplicate. P1 and LTNP2 were used in three experiments done in duplicate along with the uninfected control FTOC (Uninf.). Two weeks postinfection, cells were isolated, incubated with CD4-PE and CD8 PerCP, and analyzed with a FACSCalibur flow cytometer. (A) Representative dot plots showing CD4 and CD8 expression on thymocytes recovered from FTOC 2 weeks postinfection with the indicated HIV-1 clone or from the uninfected control. (B) The average percentages of CD4+ thymocytes (CD4SP and DP) remaining 2 weeks postinfection with the indicated HIV-1 clone or in uninfected control FTOC are shown, with error bars indicating the standard errors of the means (SEM) for two to three independent experiments done in duplicate. (C) Bars indicate the average ratios of the percentages of CD4SP cells to CD8SP cells remaining 2 weeks postinfection with the indicated HIV-1 clone or in uninfected control FTOC. The error bars indicate the SEM for two to three independent experiments done in duplicate. (D) Viral replication in FTOC was quantified by measuring HIV-1 capsid antigen (p24) concentration in FTOC medium with a commercial ELISA kit (NEN Life Science Products). The bars represent viral replication on days 6 and 9 postinfection in a representative experiment.
FIG.2.
FIG.2.
HIV-1 replication and cytopathic effects in cytokine-treated FTOC infected ex vivo. FTOC was infected with the X4 HIV-1 molecular clone NL4-3, R5 HIV-1 progressor clone P1, R5 HIV-1 rapid progressor clone RP1, R5 HIV-1 long-term nonprogressor clones LTNP1 and LTNP2, or not infected. FTOC was maintained with IL-2, IL-4, and IL-7 for 12 days with daily medium changes. At 6, 9, and 12 days postinfection, cells were isolated and incubated with CD4-PE and CD8-PerCP. CD4+ T-cell depletion was assessed by flow cytometry with a FACSCalibur instrument. (A) Representative dot plots showing two-color staining of thymocytes in FTOC. Thymocyte expression of CD4 and CD8 are represented in the dot plot for each time point; the percentages of all gated cells found in each positive quadrant are shown. (B) The data shown are the average numbers of light scatter-gated DP, CD4SP, and CD8SP thymocytes analyzed in cytokine-treated FTOC on day 6, 9, and 12 postinfection with NL4-3, progressor-derived R5 HIV-1, LTNP-derived R5 HIV-1 or uninfected control. The numbers of samples used to obtain the data on days 6, 9, and 12 postinfection, respectively, are as follows: n = 10, 20, and 20 for the uninfected control; n = 10, 14, and 14 for NL4-3; n = 4, 9, and 9 for P1; n = 8, 19, and 19 for RP1; n = 5, 8, and 7 for LTNP1; and n = 4, 8, and 10 for LTNP2. Data from infections by the two progressor-derived R5 HIV-1 clones were averaged, as were data from infections by the two LTNP-derived R5 HIV-1 clones. (C) The results shown are the average percentages of CD4+ thymocytes (CD4SP and DP), with error bars indicating the SEM for four to seven independent experiments repeated two, three, or five times. The number of experiments averaged was the same as for panel B. (D) The ratio of CD4SP-to-CD8SP thymocytes is shown for HIV-1-infected or uninfected FTOC. Data from one representative experiment of seven separate FTOC experiments are shown. Data for duplicate cultures are shown with adjacent bars. (E) Viral replication was quantified by measuring HIV-1 capsid antigen (p24) concentration in FTOC medium on day 4, 6, 9, and 12 postinfection with a commercial ELISA kit (NEN Life Science Products). Each dot represents measurement of the medium from an individual FTOC; the bars show the average values. Uninf., uninfected control.
FIG. 3.
FIG. 3.
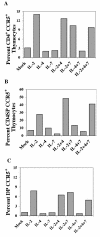
Cytokine treatment induces CCR5 expression on CD4+ thymocytes. FTOC was maintained with or without the cytokines IL-2, IL-4, and IL-7, alone or in combination, as indicated and as described in Materials and Methods. Thymocytes were recovered on day 7 and incubated with CD3-FITC, CD4-PE, CD8-PerCP, and anti-CCR5 (2D7-APC). The cells were gated on CD3, and CCR5 expression was measured on (A) total CD4+ thymocytes, (B) CD4SP thymocytes, or (C) DP thymocytes. Mock, mock-infected control.
FIG. 4.
FIG. 4.
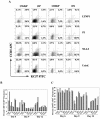
Depletion of CCR5+ and CCR5 thymocytes and down-modulation of CD4 and CCR5 in HIV-1-infected, cytokine-treated FTOC. FTOC was infected with the X4 HIV-1 molecular clone NL4-3, R5 HIV-1 biological clones P1 and LTNP2 or not infected. FTOC was cultured with cytokines as described for Fig. 2, and thymocytes were recovered 6, 9, and 12 days postinfection and incubated with CD4-PE, CD8-PerCP, CCR5-APC and then fixed, permeabilized, and incubated with anti-HIV-1 p24 (KC57-FITC) as described in Materials and Methods. (A) Data are from one representative experiment showing cell surface CCR5 expression and internal HIV-1 capsid antigen (p24) expression among the four major subsets of light scatter-gated thymocytes defined by CD4 and CD8 expression 6 days postinfection as indicated. (B) The bars represent the percentage of light scatter-gated thymocytes remaining in representative FTOC that were CD4 positive and CCR5 positive or (C) CD4 positive and CCR5 negative on the indicated day postinfection with NL4-3, the indicated R5 HIV-1 clone or in the uninfected control (Uninf.).
FIG. 5.
FIG. 5.
Down-modulation of CD4 on HIV-1-infected thymocytes is a minor component of the CD4+ thymocyte depletion seen following HIV-1 infection of cytokine-treated FTOC. The bars represent the percentages of thymocytes that were CD4+ remaining in FTOC following HIV-1 infection or in the uninfected control FTOC (light portions of the bars), plus the percentage that down-modulated CD4 (dark portions of the bars). The total height of each bar, therefore, represents the percentage of CD4+ or formerly CD4+ thymocytes remaining on the day shown, following FTOC infection with each HIV-1 clone depicted or in the uninfected control (Uninf.).
FIG. 6.
FIG. 6.
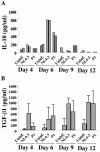
Induction of IL-10 and TGF-β1 expression in HIV-1-infected, cytokine-treated FTOC. FTOC was infected with the X4 HIV-1 molecular clone, NL4-3, the R5 HIV-1 biological clone, P1, or not infected. FTOC was maintained with IL-2, IL-4, and IL-7 for 12 days with daily medium changes as described in Materials and Methods. Cytokine production in FTOC medium was measured on days 4, 6, 9, and 12 postinfection by commercial ELISA (R&D Systems). (A) The results from a representative experiment are shown with adjacent bars showing duplicate cultures. (B) The results shown are the averages for three experiments, performed in duplicate, along with error bars depicting the standard errors of the means. Uninf., uninfected control.
FIG. 7.
FIG. 7.
Effect of IL-10 and TGF-β1 on CCR5 expression on CD4+ thymocytes in FTOC. FTOC was maintained in the absence or presence of IL-10 (2 ng/ml), TGF-β1 (2 ng/ml), or both cytokines with medium changes every second day. No other cytokines were used. CCR5 expression on CD4+ thymocytes was determined on day 7 by flow cytometry. (A) Representative dot plots for one of three independent experiments are shown. (B) The average values obtained in three independent experiments are shown along with the standard errors of the means for each measure. Mock, mock-infected control.
FIG. 8.
FIG. 8.
Effect of IL-10 and TGF-β1 on CCR5 expression on CD4+ thymocytes in TAC. TAC was maintained in the presence of IL-7 (1 ng/ml) and treated with either medium alone, IL-2 (20 IU/ml), or two concentrations of IL-10 and TGF-β1, as indicated. CCR5 expression on CD4+ thymocytes was determined on the indicated days following initiation of TAC by flow cytometry. (A) The average values obtained in a representative experiment done in duplicate are shown with error bars indicating standard errors of the means. (B) Representative dot plots showing expression of CCR5 on CD4SP thymocytes on day 11, when CCR5 expression peaked for cells treated with IL-2 (20 IU/ml), IL-10 (5 ng/ml), or TGF-β1 (5 ng/ml). Mock, mock-infected control.

Similar articles

Cited by

References

    1. Aldrovandi, G. M., G. Feuer, L. Gao, B. Jamieson, M. Kristeva, I. S. Chen, and J. A. Zack. 1993. The SCID-hu mouse as a model for HIV-1 infection. Nature 363:732-736. - PubMed
    1. Badou, A., Y. Bennasser, M. Moreau, C. Leclerc, M. Benkirane, and E. Bahraoui. 2000. Tat protein of human immunodeficiency virus type 1 induces interleukin-10 in human peripheral blood monocytes: implication of protein kinase C-dependent pathway. J. Virol. 74:10551-10562. - PMC - PubMed
    1. Berger, E. A., P. M. Murphy, and J. M. Farber. 1999. Chemokine receptors as HIV-1 coreceptors: roles in viral entry, tropism, and disease. Annu. Rev. Immunol. 17:657-700. - PubMed
    1. Berkowitz, R. D., K. P. Beckerman, T. J. Schall, and J. M. McCune. 1998. CXCR4 and CCR5 expression delineates targets for HIV-1 disruption of T cell differentiation. J. Immunol. 161:3702-3710. - PubMed
    1. Blaak, H., M. Brouwer, L. J. Ran, F. de Wolf, and H. Schuitemaker. 1998. In vitro replication kinetics of human immunodeficiency virus type 1 (HIV-1) variants in relation to virus load in long-term survivors of HIV-1 infection. J. Infect. Dis. 177:600-610. - PubMed

Publication types