Conditional disruption of IkappaB kinase 2 fails to prevent obesity-induced insulin resistance
- PMID: 14755344
- PMCID: PMC324533
- DOI: 10.1172/JCI18712
Conditional disruption of IkappaB kinase 2 fails to prevent obesity-induced insulin resistance
Abstract
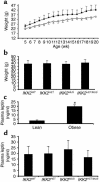
The inhibitor of NF-kappaB (IkappaB) kinases (IKK1[alpha] and IKK2[beta]), the catalytic subunits of the IKK complex, phosphorylate IkappaB proteins on serine residues, targeting them for degradation and thus activating the transcription factor NF-kappaB. More recently, IKK2 has been implicated in mediation of insulin resistance caused by obesity, lipid infusion, and TNF-alpha stimulation, since salicylate and aspirin, known inhibitors of IKK activity, can reverse insulin resistance in obese mouse models. To further genetically elucidate the role of IKK2 in obesity-mediated insulin resistance, we have conditionally inactivated the mouse IKK2 gene in adult myocytes by Cre-loxP-mediated recombination in vivo. We have investigated the development of obesity-induced insulin resistance in muscle-specific IKK2 knockout mice and mice exhibiting a 50% reduction of IKK2 expression in every tissue and have found that, after gold thioglucose treatment, wild-type and mutant mice developed obesity to a similar extent. Surprisingly, no difference in obesity-induced insulin resistance was detectable, either at a physiological or at a molecular level. Moreover, impaired glucose tolerance resulting from a high-fat diet occurred to the same degree in control and IKK2 mutant mice. These data argue against a substantial role for muscular IKK2 in mediating obesity-induced insulin resistance in these models in vivo.
Figures


Similar articles
-
IkappaB kinase (IKK)-associated protein 1, a common component of the heterogeneous IKK complex.Mol Cell Biol. 1999 Feb;19(2):1526-38. doi: 10.1128/MCB.19.2.1526. Mol Cell Biol. 1999. PMID: 9891086 Free PMC article.
-
Local and systemic insulin resistance resulting from hepatic activation of IKK-beta and NF-kappaB.Nat Med. 2005 Feb;11(2):183-90. doi: 10.1038/nm1166. Epub 2005 Jan 30. Nat Med. 2005. PMID: 15685173 Free PMC article.
-
TNF-mediated inflammatory skin disease in mice with epidermis-specific deletion of IKK2.Nature. 2002 Jun 20;417(6891):861-6. doi: 10.1038/nature00820. Nature. 2002. PMID: 12075355
-
Inflammation and the IKK beta/I kappa B/NF-kappa B axis in obesity- and diet-induced insulin resistance.Int J Obes Relat Metab Disord. 2003 Dec;27 Suppl 3:S49-52. doi: 10.1038/sj.ijo.0802501. Int J Obes Relat Metab Disord. 2003. PMID: 14704745 Review.
-
Phosphorylation meets ubiquitination: the control of NF-[kappa]B activity.Annu Rev Immunol. 2000;18:621-63. doi: 10.1146/annurev.immunol.18.1.621. Annu Rev Immunol. 2000. PMID: 10837071 Review.
Cited by
-
NF-κB-Inducing Kinase Provokes Insulin Resistance in Skeletal Muscle of Obese Mice.Inflammation. 2023 Aug;46(4):1445-1457. doi: 10.1007/s10753-023-01820-7. Epub 2023 May 12. Inflammation. 2023. PMID: 37171694
-
Heterogeneous effects of individual high-fat diet compositions on phenotype, metabolic outcome, and hepatic proteome signature in BL/6 male mice.Nutr Metab (Lond). 2023 Feb 8;20(1):8. doi: 10.1186/s12986-023-00729-0. Nutr Metab (Lond). 2023. PMID: 36755289 Free PMC article.
-
Recent Advances in Understanding the Role of IKKβ in Cardiometabolic Diseases.Front Cardiovasc Med. 2021 Dec 8;8:752337. doi: 10.3389/fcvm.2021.752337. eCollection 2021. Front Cardiovasc Med. 2021. PMID: 34957242 Free PMC article. Review.
-
Inhibition of Bruton's TK regulates macrophage NF-κB and NLRP3 inflammasome activation in metabolic inflammation.Br J Pharmacol. 2020 Oct;177(19):4416-4432. doi: 10.1111/bph.15182. Epub 2020 Aug 26. Br J Pharmacol. 2020. PMID: 32608058 Free PMC article.
-
[Correlation between serum microRNA-122 and insulin resistance in obese children].Zhongguo Dang Dai Er Ke Za Zhi. 2019 Sep;21(9):910-914. doi: 10.7499/j.issn.1008-8830.2019.09.013. Zhongguo Dang Dai Er Ke Za Zhi. 2019. PMID: 31506152 Free PMC article. Chinese.
References
-
- Karin M, Delhase M. The I kappa B kinase (IKK) and NF-kappa B: key elements of proinflammatory signalling. Semin. Immunol. 2000;12:85–98. - PubMed
-
- Zandi E, Rothwarf DM, Delhase M, Hayakawa M, Karin M. The IkappaB kinase complex (IKK) contains two kinase subunits, IKKalpha and IKKbeta, necessary for IkappaB phosphorylation and NF-kappaB activation. Cell. 1997;91:243–252. - PubMed
-
- Karin M, Ben-Neriah Y. Phosphorylation meets ubiquitination: the control of NF-κB activity. Annu. Rev. Immunol. 2000;18:621–663. - PubMed
-
- Tanaka M, et al. Embryonic lethality, liver degeneration, and impaired NF-kappa B activation in IKK-beta-deficient mice. Immunity. 1999;10:421–429. - PubMed
Publication types
MeSH terms
Substances
LinkOut - more resources
Full Text Sources
Medical
Molecular Biology Databases

