. 2003 Dec 1;198(11):1741-52.
doi: 10.1084/jem.20022227.

Transforming growth factor-beta production and myeloid cells are an effector mechanism through which CD1d-restricted T cells block cytotoxic T lymphocyte-mediated tumor immunosurveillance: abrogation prevents tumor recurrence

Affiliations

Transforming growth factor-beta production and myeloid cells are an effector mechanism through which CD1d-restricted T cells block cytotoxic T lymphocyte-mediated tumor immunosurveillance: abrogation prevents tumor recurrence

Masaki Terabe et al. J Exp Med. .

Abstract

Our previous work demonstrated that cytotoxic T lymphocyte (CTL)-mediated tumor immunosurveillance of the 15-12RM tumor could be suppressed by a CD1d-restricted lymphocyte, most likely a natural killer (NK) T cell, which produces interleukin (IL)-13. Here we present evidence for the effector elements in this suppressive pathway. T cell-reconstituted recombination activating gene (RAG)2 knockout (KO) and RAG2/IL-4 receptor alpha double KO mice showed that inhibition of immunosurveillance requires IL-13 responsiveness by a non-T non-B cell. Such nonlymphoid splenocytes from tumor-bearing mice produced more transforming growth factor (TGF)-beta, a potent inhibitor of CTL, ex vivo than such cells from naive mice, and this TGF-beta production was dependent on the presence in vivo of both IL-13 and CD1d-restricted T cells. Ex vivo TGF-beta production was also abrogated by depleting either CD11b+ or Gr-1+ cells from the nonlymphoid cells of tumor-bearing mice. Further, blocking TGF-beta or depleting Gr-1+ cells in vivo prevented the tumor recurrence, implying that TGF-beta made by a CD11b+ Gr-1+ myeloid cell, in an IL-13 and CD1d-restricted T cell-dependent mechanism, is necessary for down-regulation of tumor immunosurveillance. Identification of this stepwise regulation of immunosurveillance, involving CD1-restricted T cells, IL-13, myeloid cells, and TGF-beta, explains previous observations on myeloid suppressor cells or TGF-beta and provides insights for targeted approaches for cancer immunotherapy, including synergistic blockade of TGF-beta and IL-13.


Figures

Figure 1.
Figure 1.
TGF-β1 but not IL-13 can directly suppress CTL induction in vitro. 4 × 10⁶ spleen cells from mice immunized with vPE16 were stimulated in vitro with 106 P18-pulsed spleen cells for 6 d. During in vitro stimulation, in addition to IL-2 (▪ and □), in A the cells were maintained with 50 ng/ml (• and ○), 5 ng/ml (⋄ and ♦), or 0.5 ng/ml (▴ and ▵) of IL-13 or in B, 100 ng/ml (• and ○), 10 ng/ml (⋄ and ♦), or 1 ng/ml (▴ and ▵) of TGF-β was added. The cultured cells were used for CTL assay at the E/T ratios shown. Targets were 18Neo fibroblasts either without peptide (open symbols) or pulsed with 1 μM P18-IIIB peptide (solid symbols). The data shown are representative of three independent experiments.
Figure 2.
Figure 2.
Non–T non–-B cells are the cells responding to IL-13 that down-regulate tumor immunosurveillance. RAG2 KO and RAG2/IL-4Rα KO mice were injected i.v. with 5 × 10⁷ purified T cells from the spleens of wild-type or IL-4Rα KO mice. These T cells were purified by depleting cells expressing MHC class II, CD11b, CD11c, and DX5 cells from spleen cells by using magnetic beads conjugated with antibodies against each molecule. 1 wk later, the mice were injected s.c. with 106 15-12RM tumor cells. RAG2 KO or RAG2/IL-4Rα KO mice lack T and B cells. T cells from IL-4Rα KO mice and nonlymphoid host cells from RAG2/IL-4Rα double KO mice cannot respond to IL-4 or IL-13. Five mice were used for each group. The result shown is representative of three experiments.
Figure 3.
Figure 3.
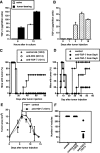
TGF-β1 production was increased in nonlymphoid spleen cells (non–T non–B non–NK cells) from 15-12RM–injected BALB/c mice and anti–TGF-β antibody prevents tumor recurrence. (A) On day 3 after 15-12RM injection, freshly isolated nonlymphoid cells from naive BALB/c (open bar) and 15-12RM tumor-injected BALB/c mice (solid bar) were examined for TGF-β1 production ex vivo. Nonlymphoid cells were purified from spleen cells of BALB/c mice by depletion of T cells, B cells, and NK cells. 2 × 10⁵ cells were cultured in vitro without stimulation in a 96-well plate in 200 μl X Vivo 20 medium. The concentration of TGF-β1 was determined by ELISA. Each value shows the average ± SD of triplicate assay. P < 0.005 at 6 h and P < 0.01 at 12 h with Student's t test between naive and tumor-bearing groups. Error bars not shown are too small to be seen on this scale. This experiment is representative of 10 experiments with similar results. (B) Freshly isolated nonlymphoid cells were prepared from 15-12RM–injected mice at different time points after tumor injection, and were examined for TGF-β1 production ex vivo as described in A. (C) Anti-CD4–treated mice (○), anti–TGF-β–treated mice (▴), or control isotype-matched antibody-treated (⋄) BALB/c mice (five per group) were injected with 106 15-12RM cells s.c. 0.5 mg of the anti-CD4 mAb was inoculated on days 0, 1, 2, 6, and 10 after tumor injection. 100 μg anti–TGF-β mAb or isotype-matched control mAb were injected every other day from days 0 to 10. P < 0.05 with log-rank test between the control group and the anti–TGF-β group. This experiment is representative of three experiments with similar results. (D) After s.c. inoculation of 15-12RM cells, the mice (five per group) were treated with 100 μg anti–TGF-β antibody from day 0 (•) or day 5 (▴), or control isotype-matched antibody (⋄) every other day for 10 d. (E) Size of primary tumors in 15-12RM–injected BALB/c mice treated with 100 μg anti–TGF-β mAb (•) i.p. every other day for 10 d or without any antibody treatment (⋄). The mice were inoculated s.c. with 106 15-12RM cells. Tumor size was measured in two perpendicular dimensions with calipers every other day. The vertical axis shows tumor area measured as the product of these two dimensions. This experiment is representative of four independent experiments. (F) BALB/c mice (five per group) injected with 2 × 10⁵ CT26 were treated with 0.1 mg anti–TGF-β mAb or isotype-matched control mAb every other day for 2 wk. On day 21, the mice were killed and the lungs were perfused with a 15% solution of India ink. After fixation by Fekete's solution, the number of nodules was macroscopically counted. The maximum number of the nodules counted per lung was 250. The mean number of nodules is indicated as horizontal bars. P < 0.0001 with one way analysis of variance test for the anti–TGF-β group compared with control and control mAb groups. Similar results were obtained in another experiment.
Figure 4.
Figure 4.
CTL induction was down-regulated by non–T non–NK cells from 15-12RM–injected mice through TGF-β. On day 3 after 15-12RM injection, non–T non–NK cells were prepared from spleen cells of tumor-bearing (▴ and ▵, and ⋄ and ♦) and naive BALB/c mice (▪ and □, and • and ○) by negatively depleting CD4+, CD8+, and DX5+ cells, and pulsed with 1 μM P18 peptide. Splenic T cells from vPE16-immunized mice were stimulated in vitro in the presence of these non–T non–NK cells for 1 wk. In addition to IL-2 added to all cultures, 50 μg/ml anti–TGF-β was added (solid symbols) or omitted (open symbols) during in vitro stimulation. The cultured cells were harvested and used for CTL assay. Targets were 18Neo fibroblasts pulsed either with P18 peptide (▪ and □, and ▴ and ▵) or without peptide (• and ○, and ⋄ and ♦). A similar result was obtained in another independent experiment.
Figure 5.
Figure 5.
In vivo TGF-β1 production was down-regulated in IL-13 inhibitor treated wild-type mice or CD1 KO mice injected with 15-12RM tumor cells. (A) On day 3 after 15-12RM tumor injection, freshly isolated nonlymphoid cells from naive (open bar), 15-12RM tumor-injected mice (solid bar), and 15-12RM tumor-injected mice treated with IL-13 inhibitor (gray bar) were examined for TGF-β1 production ex vivo. 0.2 mg IL-13 inhibitor (sIL-13Rα2-Fc) was administrated i.p. on days 0, 1, and 2 after tumor injection. (B) Naive wild-type BALB/c (open bar), 15-12RM tumor-injected wild-type BALB/c (solid bar), and tumor-injected CD1 KO BALB/c mice (gray bar) were used as a source of nonlymphoid cells on day 3 of tumor injection. As in Fig. 3 A, in both A and B, 2 × 10⁵ cells purified were cultured in vitro without stimulation. The culture supernatant was collected at 6 h and the concentration of TGF-β1 was determined by ELISA. Each value shows the average ± SD of triplicate assay. Error bars not shown are too small to be seen on this scale. Similar results were obtained in three independent experiments.
Figure 6.
Figure 6.
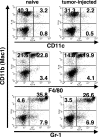
Flow cytometric staining of splenic nonlymphoid cells from naive and 15-12RM tumor-injected BALB/c mice. Nonlymphoid cells were prepared from spleen cells of naive and 15-12RM–injected mice (day 3) by depleting CD4+, CD8+, B220+, and DX5+ cells with magnetic beads. The cells were stained with PE- and FITC-conjugated anti-CD11b, PE-conjugated anti-CD11c, FITC-conjugated anti-F4/80, and FITC-conjugated anti–Gr-1, washed, and analyzed by flow cytometry. This experiment is representative of 10 experiments with similar results.
Figure 7.
Figure 7.
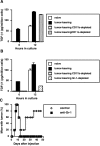
CD11b+ cells and Gr-1+ cells are the major source of TGF-β1 and necessary for down-regulation of tumor immunosurveillance. (A and B) On day 3 after 15-12RM injection, nonlymphoid spleen cells were purified from naive (open bar) and tumor-injected BALB/c mice (solid bars) as in Fig. 3 A. CD11b+ (hatched bars) or CD11c+ (tightly dotted) were depleted with magnetic beads during purification of the cells from tumor-injected mice in A. CD11b+ (hatched bars) or Gr-1+ (dotted bars) cells were depleted during purification of the cells from tumor-injected mice, the latter using biotinylated antibody and avidin-coated magnetic beads in B. As in Fig. 3 A, in both A and B, 2 × 10⁵ cells were cultured in vitro without stimulation. The concentration of TGF-β1 in media was determined by ELISA. Each value shows the average ± SD of triplicate assay. CD11b+- and Gr-1+–depleted cells produced significantly less TGF-β1 (P < 0.001, respectively) than the untreated cells from tumor-bearing mice. Error bars not shown are too small to be seen on this scale. This experiment is representative of three experiments with similar results. (C) Anti–Gr-1–treated mice (▪) or control BALB/c mice (⋄; five per group) were injected with 106 15-12RM cells s.c. The anti–Gr-1 antibody (1 μg) was inoculated on days 5, 6, 10, 15, and 20 after 15-12RM injection. P < 0.05 with log-rank test between the control group and the anti–Gr-1–treated group. This experiment is representative of three experiments with similar results.
Figure 8.
Figure 8.
Characterization of Gr-1+ CD11b+ cells. On day 3 after 15-12RM injection, single cell suspensions of spleen cells from tumor-bearing and naive BALB/c mice were prepared. (A) The cells were stained with FITC-conjugated anti–Gr-1, Per-CP–conjugated anti-CD11b antibodies in combination with PE-conjugated anti-F4/80, APC-conjugated anti-CD31, or PE-conjugated anti–IL-4Rα antibodies and analyzed by flow cytometry. During the analysis of the data acquired, we first gated on Gr-1+ CD11b+ cells and analyzed for the expression of other molecules. The numbers indicated are the percentage of the cells positive for each marker among the Gr-1+ CD11b+ cells. (B) Nonlymphoid cells were stained with FITC-conjugated anti–Gr-1, Per-CP–conjugated anti-CD11b antibodies. The cells were preparatively sorted by flow cytometry to select Gr-1hi CD11b+ (top) and Gr-1int CD11b+ populations (bottom). The sorted cells were collected by cytospin on glass slides, dried overnight, and stained with Wright-Giemsa stain. Pictures were taken under a microscope at ×20. Arrows indicate monocytes and arrowheads indicate immature granulocytes with band morphology.
Figure 9.
Figure 9.
In vivo blockade of NO production did not alter tumor growth. BALB/c mice (five per group) were injected with 106 15-12RM cells s.c. Where indicated, mice were treated with 0.2 mg l-NAME (•) or d-NAME (▵) every day for 2 wk. Control mice were inoculated with tumors without other treatment (⋄). Similar results were obtained in an independent experiment.
Figure 10.
Figure 10.
Proposed model of negative immunoregulatory circuit of CTL-mediated tumor immunosurveillance mediated by TGF-β, myeloid cells, IL-13, and CD1d-restricted T cells, probably NKT cells. Tumor antigen (glycolipid) presented by antigen-presenting cells via the CD1d molecule is recognized by and activates CD1d-restricted CD4+ NKT cells. The activated CD4+ NKT cell produces IL-13, which acts on Gr-1+ CD11b+ myeloid cells that express the IL-13 receptor. The Gr-1+ CD11b+ myeloid cell produces TGF-β to suppress CD8+ CTLs (CTL) that can kill tumor cells, thereby down-regulating tumor immunosurveillance. This pathway is able to be blocked by IL-13 inhibitor and anti–TGF-β antibody.

Similar articles

Cited by

References

    1. Dunn, G.P., A.T. Bruce, H. Ikeda, L.J. Old, and R.D. Schreiber. 2002. Cancer immunoediting: from immunosurveillance to tumor escape. Nat. Immunol. 3:991–998. - PubMed
    1. Khong, H.T., and N.P. Restifo. 2002. Natural selection of tumor variants in the generation of “tumor escape” phenotypes. Nat. Immunol. 3:999–1005. - PMC - PubMed
    1. Matsui, S., J.D. Ahlers, A.O. Vortmeyer, M. Terabe, T. Tsukui, D.P. Carbone, L.A. Liotta, and J. Berzofsky. 1999. A model for CD8+ CTL tumor immunosurveillance and regulation of tumor escape by CD4 T cells through an effect on quality of CTL. J. Immunol. 163:184–193. - PubMed
    1. Terabe, M., S. Matsui, N. Noben-Trauth, H. Chen, C. Watson, D.D. Donaldson, D.P. Carbone, W.E. Paul, and J.A. Berzofsky. 2000. NKT cell-mediated repression of tumour immunosurveillance by IL-13 and the IL-4R-STAT6 pathway. Nat. Immunol. 1:515–520. - PubMed
    1. Ostrand-Rosenberg, S., M.J. Grusby, and V.K. Clements. 2000. Cutting edge: STAT6-deficient mice have enhanced tumor immunity to primary and metastatic mammary carcinoma. J. Immunol. 165:6015–6019. - PubMed