. 1992 Oct 22;359(6397):693-9.
doi: 10.1038/359693a0.

Targeted disruption of the mouse transforming growth factor-beta 1 gene results in multifocal inflammatory disease

Affiliations

Targeted disruption of the mouse transforming growth factor-beta 1 gene results in multifocal inflammatory disease

M M Shull et al. Nature. .

Abstract

Transforming growth factor-beta 1 (TGF-beta 1) is a multifunctional growth factor that has profound regulatory effects on many developmental and physiological processes. Disruption of the TGF-beta 1 gene by homologous recombination in murine embryonic stem cells enables mice to be generated that carry the disrupted allele. Animals homozygous for the mutated TGF-beta 1 allele show no gross developmental abnormalities, but about 20 days after birth they succumb to a wasting syndrome accompanied by a multifocal, mixed inflammatory cell response and tissue necrosis, leading to organ failure and death. TGF-beta 1-deficient mice may be valuable models for human immune and inflammatory disorders, including autoimmune diseases, transplant rejection and graft versus host reactions.


Figures
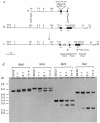
FIG. 1
FIG. 1
Targeted disruption of the murine TGF-β1 gene in ES cells. a, Targeting construct consisting of a TGF-β1 4.0-kb Smal genomic fragment containing exon 6 and part of exon 7. A neor gene lacking the polyadenylation signal (XhoI-SaI1 fragment from pMC1 neo; ref. 52) was inserted into the BamHI site in exon 6 of TGF-β1, 102 nucleotides (34 amino acids) from the N terminus of the mature peptide, b, Restriction map of the wild-type TGF-β1 genomic locus surrounding the targeting site. e, Predicted structure of the disrupted TGF-β1 allele. Arrowheads represent positions of primers used for PCR analysis. The 5′ primer (5′-GCTTTACGGTATCGCCGCTC-3′) is located 68 nucieotides upstream of the stop codon in neo. The 3′ primer (5′-TGCGACCCACGT AGT AGACG-3′) is located 74 nucleotides down-stream of the Sma I site in exon 7 of TGF-β1 and is not contained in the targeting vector. The locations of probes used in Southern analysis are shown. Probe A is from the neor gene (XhoI-SaI1 fragment from pMC1 neo). Probe B is a 0.6-kb TGF-β1 genomic fragment (BamHI-SmaI). Probe C is a 0.7-kb TGF-β1 genomic fragment (EcoRI) not contained in the targeting vector. Restriction enzymes used in diagnostic digests are: A, Apal; Bs, BstI; E, EcoRI; N, NcoI; P, PstI; Pv, PvuII; Sp, SphI; S, StuI; and X, XbaI. d, Southern blot analysis of parental D3 embryonic stem (ESD3) cells and three PCR-positive clones. Genomic DNAs (15 μg) were digested with the enzymes shown, electrophoresed through 0.8% agarose, transferred to nylon membranes, and hybridized with probe B. The observed patterns correspond to those expected from homologous recombination of the targeting vector into the TGF-β1 locus. The difference in intensity of the bands in the digests of clone 1–1 is due to the fact that this clone contained a mixed population of targeted and untransfected cells. METHODS. D3 embryonic stem (6×10⁶ cells) were electroporated with 10 μg (6 nM) of purified targeting fragment using an IBI Gene Zapper at 800 V cm−1 and 200 μF. Cells were plated on mitomycin-treated neor mouse embryonic fibroblast feeder layers. After 24 h with no selection, 400 μg ml−1 G418 was added. After further 20 h, the medium was changed to 200 μg ml−1 G418 and cells were grown in this medium for 12–14 days. G418-resistant colonies (initially in pools and then individual colonies from PCR-positive pools) were analysed for homologous recombination by PCR. Targeting was confirmed by genomic Southern blot analysis.
FIG. 2
FIG. 2
Genotype of offspring from interbreeding mice heterozygous for the targeted TGF-β1 allele. Tail DNAs from parents (116 and 119) and offspring (159–167) were digested with StuI, fractionated by electrophoresis through 0.8% agarose, transferred to nylon membranes, and hybridized with a TGF-β1 probe (probe B; Fig. 1). The upper band (6.7 kb) represents the wild-type allele and the lower band (2.5 kb) represents the targeted allele. +/+, Homozygous wild-type; +/−, heterozygote; −/−, homozygous targeted.
FIG. 3
FIG. 3
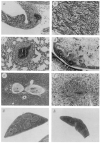
Histological analysis of TGF-β1 deficient mice. a, Heart, atrium, mouse 181, ×74. Myocarditis and pericarditis (arrow). The myocardium is infiltrated with inflammatory cells in all areas of the heart. Single cell to focal myocyte necrosis is evident. b, Heart, higher magnification (×148) ventricle, mouse 181. Inflammatory cells consist mostly of lymphocytes, but neutrophils, macrophages, and plasma cells are also present. Individual myocyte necrosis is evident (arrow). C, Lung, mouse 181, ×93, Perivasculitis. Inflammatory cells surround a vessel wall, with some oedema. The types and proportions of cells are similar to those seen in the heart. d, Stomach, gut roll, mouse 137, ×9. Severe, generalized necrosis (ulceration) of the squamous epithelium in the junction between the glandular (arrow) and nonglandular (arrowheads) portion. The submucosa is filled with mixed acute inflammatory cells (i), particularly neutrophils, and fibrin (f), with focal hemorrhage (h). Stomach lumen (S); intestine (I). e, Liver, mouse 126, ×46. Typical pattern of acute inflammatory cell infiltration in the portal triads of the liver. Infiltrating cells are most concentrated near bile ducts and consist mostly of lymphocytes and neutrophils. Bile ducts (b); portal veins (v); arteries (arrows). f, Salivary gland, mutant 181, ×74. Typical focal area of inflammatory cell infiltration seen particularly around ductal epithelium (arrows) of salivary glands and pancreas of some mutants. The inflammation is primarily lymphocytic. g, Spleen from normal littermate, 128, ×13. White pulp areas (w) are large and clearly delineated. h, Spleen from mutant 147, ×13. The white pulp areas are not detectable, and the entire spleen is smaller in cross-section. Tissues were prepared, sectioned, and stained with haematoxylin and eosin according to standard procedures.
FIG. 4
FIG. 4
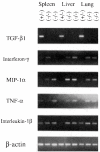
PCR analysis of cytokine mRNAs in control and TGF-β1-deficient mice. Total RNAs from spleen, liver, and lung from control mouse 249 (+/−) and homozygous mutant animals 254 and 260 (−/−) were reverse-transcribed and examined by PCR analysis using primers specific for cytokines TGF-β1 (5′-GCGGACT ACT A TGCT AAAGAGG-3′ and 5′-GTIGTGTIGGTIGT AGAGGGCA-3′, 40 cycles), interferon-γ. (5′-TGGCTGTTICTGGCTGTIACTG-3′ and 5′-AATCAGCAGCGACTCCnnCC-3′, 35 cycles), MIP-1α: (5′-ACTGCCCTIGCTGTICTICTCT-3′ and 5′-AGGCA TICAGTICCAGGTCAGT-3′,40 cycles), TNF-α: (5′-CCAGACCCTCACACTCAGAT-3′ and 5′-AACACCCATICCCTICACAG-3, 31 cycles), and interleukin-1α (5′-TGACGGACCCCAAAAGATGAAG-3′ and 5′-CTGCTIGTGAGGTGCTGA TGT A-3′, 35 cycles). Amplification conditions using a Perkin–Elmer 9600 were 95 °C, 30 S; 58 °C, 1 min; 72 °c, 2 min (extended 1 s per cycle). The final extension was allowed to continue for 10 min. Amplified products were size-fractionated by electrophoresis through agarose and visualized by ultraviolet illumination of the ethidium bromide-stained gel. With each set of samples (except TNF-α: and β-actin), positive and negative PCR controls were run. The positive control consisted of total RNA from spleen cells cultured for 48 h with concanavalin A. The negative control contained all complementary DNA synthesis and PCR reagents but lacked RNA. Correct amplification products were observed in each positive control, whereas no products were amplified in the negative controls (data not shown). All samples gave comparable signals when amplified using primers specific for β-actin (5′-GTGGGCCGCTCTAGGCACCAA-3′ and 5′-CTCTTIGATGTCACGCACGA TTIC-3′).

Similar articles

Cited by

References

    1. Barnard JA, Lyons RM, Moses HL. Biochlm biophys.Acta. 1990;1032:79–87. - PubMed
    1. Massague JA. Rev. Cell. Biol. 1990;6:597–641. - PubMed
    1. Roberts AB, Sporn MB. In: Peptide Growth Factors and Their Receptors I. Sporn MB, Roberts AB, editors. Springer; New York: 1990. pp. 419–472.
    1. Heine UI, et al. Cell. Biol. 1987;105:2861–2876. - PMC - PubMed
    1. Lehnert SA, Akhurst RJ. Development. 1988;104:263–273. - PubMed

Publication types