Monocyte chemoattractant protein 1 in obesity and insulin resistance
- PMID: 12756299
- PMCID: PMC165864
- DOI: 10.1073/pnas.1133870100
Monocyte chemoattractant protein 1 in obesity and insulin resistance
Abstract
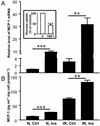
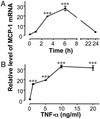
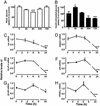
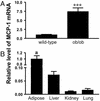
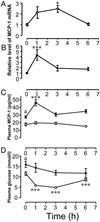
This study identifies monocyte chemoattractant protein 1 (MCP-1) as an insulin-responsive gene. It also shows that insulin induces substantial expression and secretion of MCP-1 both in vitro in insulin-resistant (IR) 3T3-L1 adipocytes and in vivo in IR obese mice (ob/ob). Thus, MCP-1 resembles other previously described genes (e.g., PAI-1 and SREBP-1c) that remain sensitive to insulin in IR states. The hyperinsulinemia that frequently accompanies obesity and insulin resistance may therefore contribute to the altered expression of these and other genes in insulin target tissues. In vivo studies also demonstrate that MCP-1 is overexpressed in obese mice compared with their lean controls, and that white adipose tissue is a major source of MCP-1. The elevated MCP-1 may alter adipocyte function because addition of MCP-1 to differentiated adipocytes in vitro decreases insulin-stimulated glucose uptake and the expression of several adipogenic genes (LpL, adipsin, GLUT-4, aP2, beta3-adrenergic receptor, and peroxisome proliferator-activated receptor gamma). These results suggest that elevated MCP-1 may induce adipocyte dedifferentiation and contribute to pathologies associated with hyperinsulinemia and obesity, including type II diabetes.
Figures
Similar articles
-
Effect of peroxisome proliferator-activated receptor-alpha ligands in the interaction between adipocytes and macrophages in obese adipose tissue.Obesity (Silver Spring). 2008 Jun;16(6):1199-207. doi: 10.1038/oby.2008.62. Epub 2008 Mar 20. Obesity (Silver Spring). 2008. PMID: 18356826
-
Plasminogen activator inhibitor-1 modulates adipocyte differentiation.Am J Physiol Endocrinol Metab. 2006 Jan;290(1):E103-E113. doi: 10.1152/ajpendo.00605.2004. Epub 2005 Sep 6. Am J Physiol Endocrinol Metab. 2006. PMID: 16144810
-
Adipose hypothermia in obesity and its association with period homolog 1, insulin sensitivity, and inflammation in fat.PLoS One. 2014 Nov 14;9(11):e112813. doi: 10.1371/journal.pone.0112813. eCollection 2014. PLoS One. 2014. PMID: 25397888 Free PMC article.
-
Adipocyte Metabolism and Insulin Signaling Perturbations: Insights from Genetics.Trends Endocrinol Metab. 2019 Jun;30(6):396-406. doi: 10.1016/j.tem.2019.03.002. Epub 2019 May 6. Trends Endocrinol Metab. 2019. PMID: 31072658 Review.
-
Monocyte Chemoattractant Protein 1 (MCP-1) in obesity and diabetes.Cytokine. 2012 Oct;60(1):1-12. doi: 10.1016/j.cyto.2012.06.018. Epub 2012 Jul 4. Cytokine. 2012. PMID: 22766373 Free PMC article. Review.
Cited by
-
Metabolomic Alteration in Adipose Monocyte Chemotactic Protein-1 Deficient Mice Fed a High-Fat Diet.Nutr Metab Insights. 2024 Sep 28;17:11786388241280859. doi: 10.1177/11786388241280859. eCollection 2024. Nutr Metab Insights. 2024. PMID: 39372559 Free PMC article.
-
Message Transmission Between Adipocyte and Macrophage in Obesity.Adv Exp Med Biol. 2024;1460:273-295. doi: 10.1007/978-3-031-63657-8_9. Adv Exp Med Biol. 2024. PMID: 39287855 Review.
-
The Role of Inflammatory Mediators in the Pathogenesis of Obesity.Nutrients. 2024 Aug 23;16(17):2822. doi: 10.3390/nu16172822. Nutrients. 2024. PMID: 39275140 Free PMC article. Review.
-
Lesson on obesity and anatomy of adipose tissue: new models of study in the era of clinical and translational research.J Transl Med. 2024 Aug 14;22(1):764. doi: 10.1186/s12967-024-05547-3. J Transl Med. 2024. PMID: 39143643 Free PMC article. Review.
-
Transcriptional control of metabolism by interferon regulatory factors.Nat Rev Endocrinol. 2024 Oct;20(10):573-587. doi: 10.1038/s41574-024-00990-0. Epub 2024 May 20. Nat Rev Endocrinol. 2024. PMID: 38769435 Free PMC article. Review.
References
-
- Zimmet, P., Alberti, K. G. & Shaw, J. (2001) Nature 414, 782-787. - PubMed
-
- Pratley, R. E. & Weyer, C. (2001) Diabetologia 44, 929-945. - PubMed
-
- Bjorntorp, P. (1999) Diabetes Metab. Res. Rev. 15, 427-441. - PubMed
-
- Haffner, S. M., Stern, M. P., Hazuda, H. P., Mitchell, B. D. & Patterson, J. K. (1988) N. Engl. J. Med. 319, 1297-1301. - PubMed
Publication types
MeSH terms
Substances
Grants and funding
LinkOut - more resources
Full Text Sources
Other Literature Sources
Medical
Research Materials
Miscellaneous

