. 2003 May 5;197(9):1093-106.
doi: 10.1084/jem.20021337.

Enhanced antitumor immunity in mice deficient in CD69

Affiliations

Enhanced antitumor immunity in mice deficient in CD69

Enric Esplugues et al. J Exp Med. .

Abstract

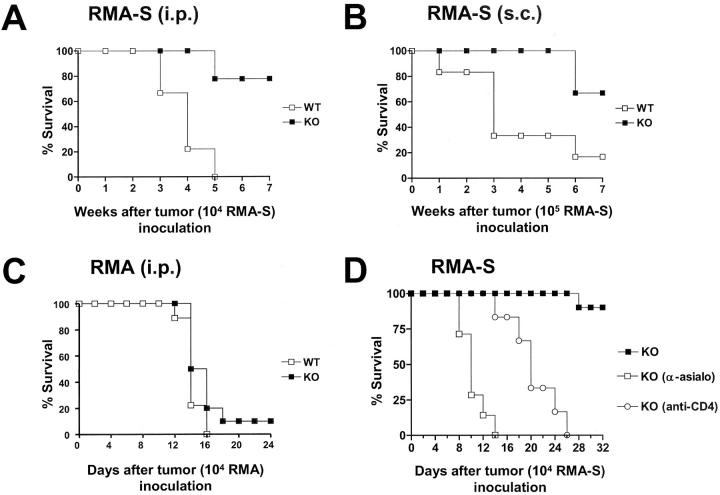
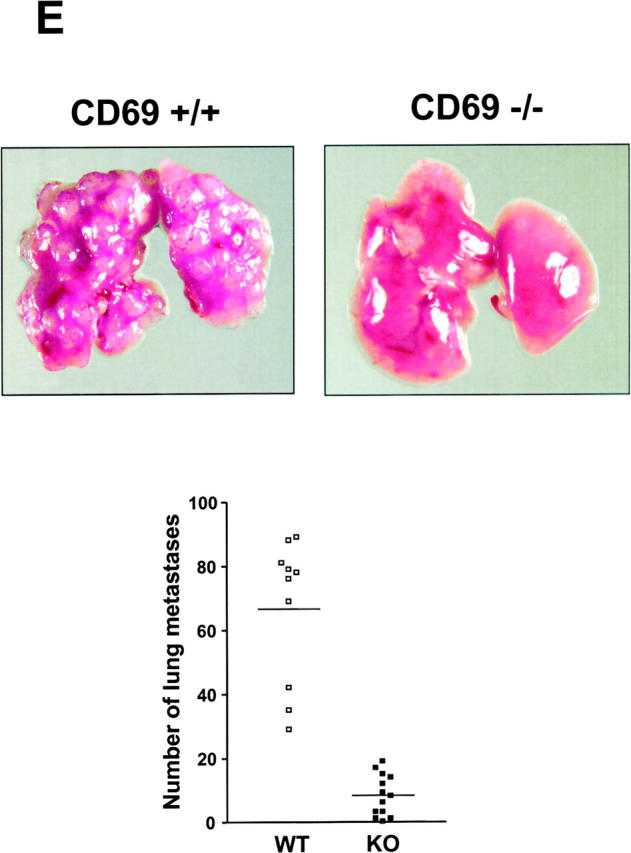
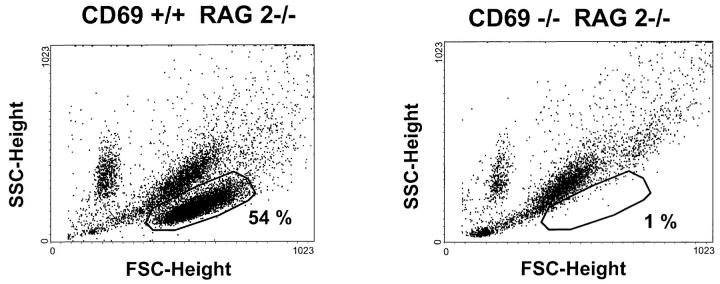
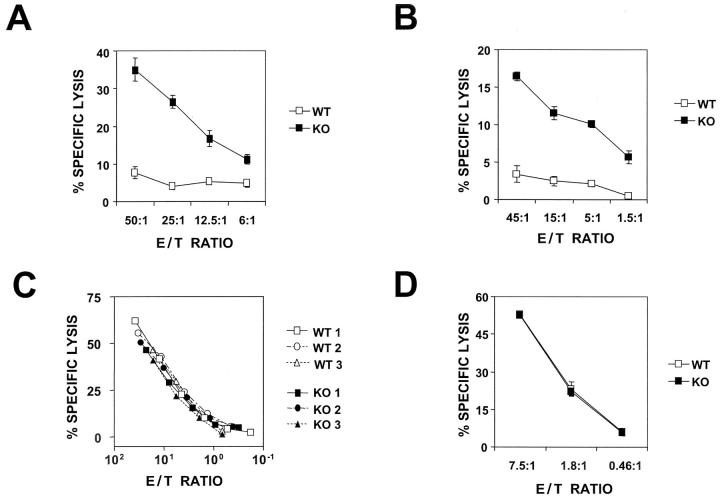
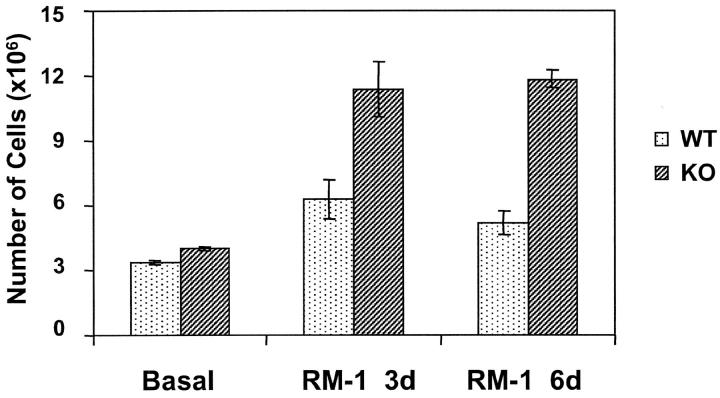
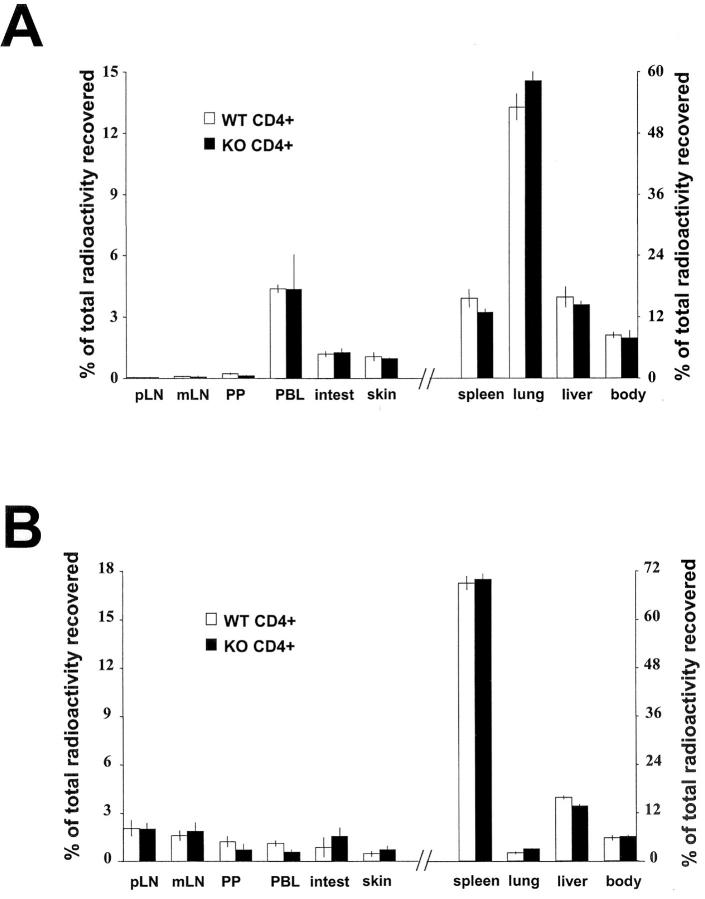
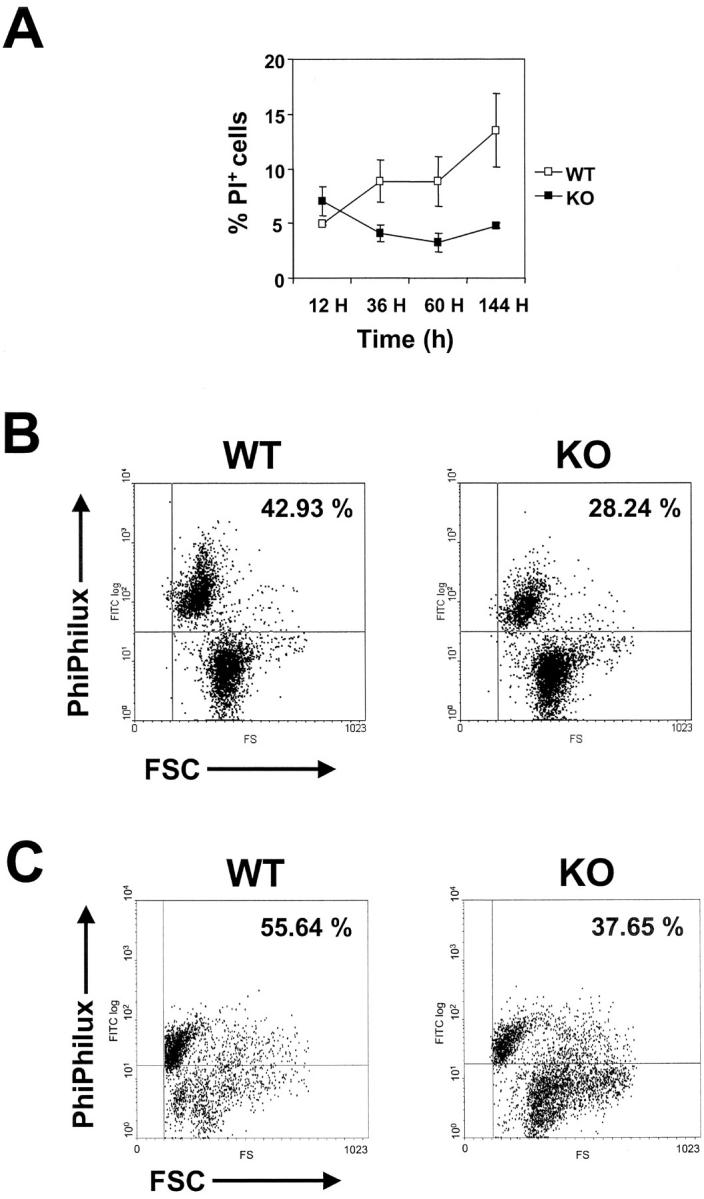
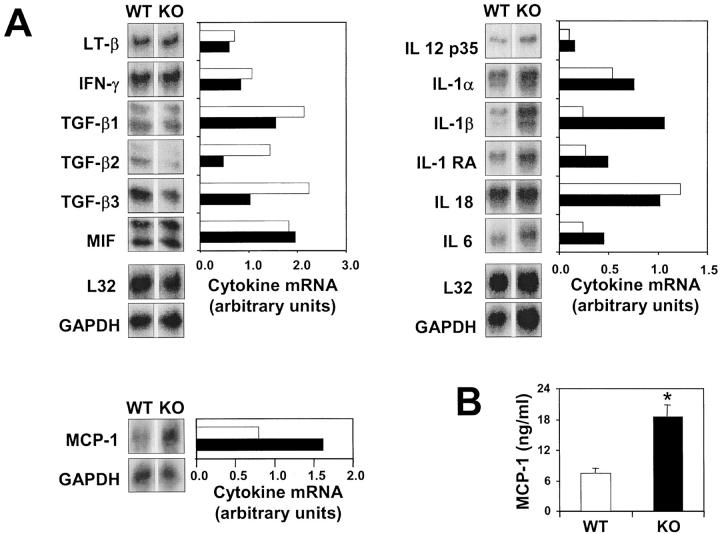
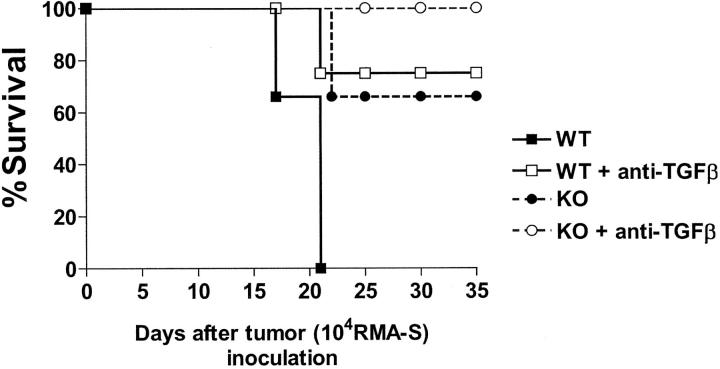
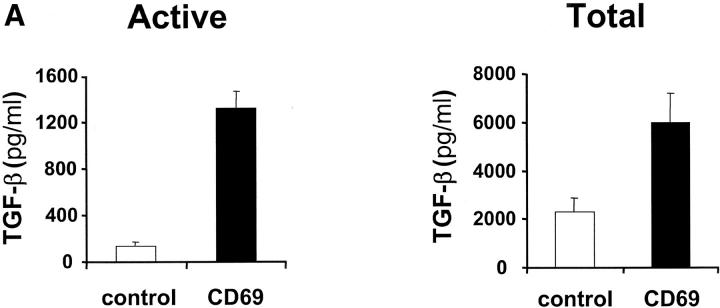
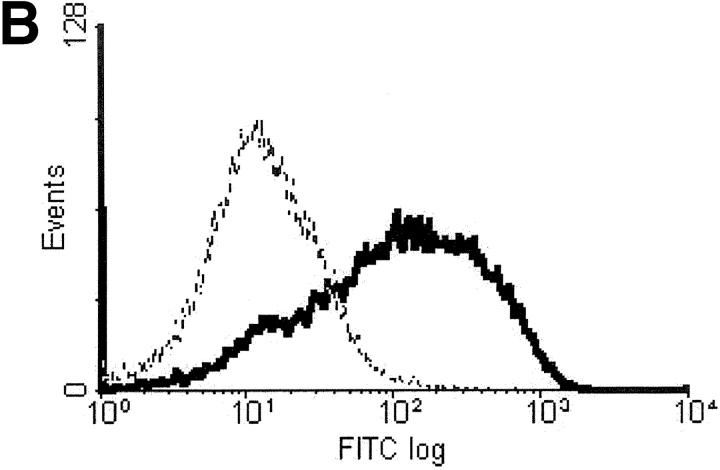
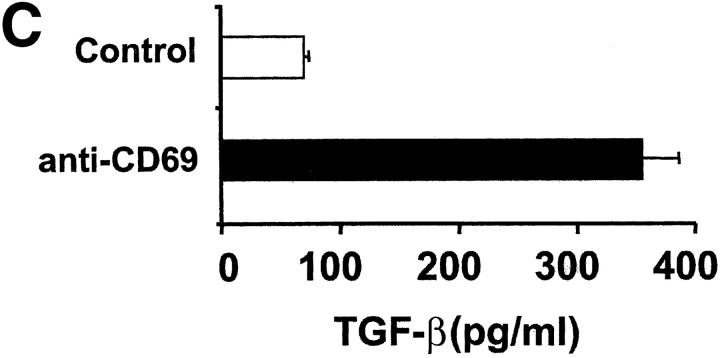
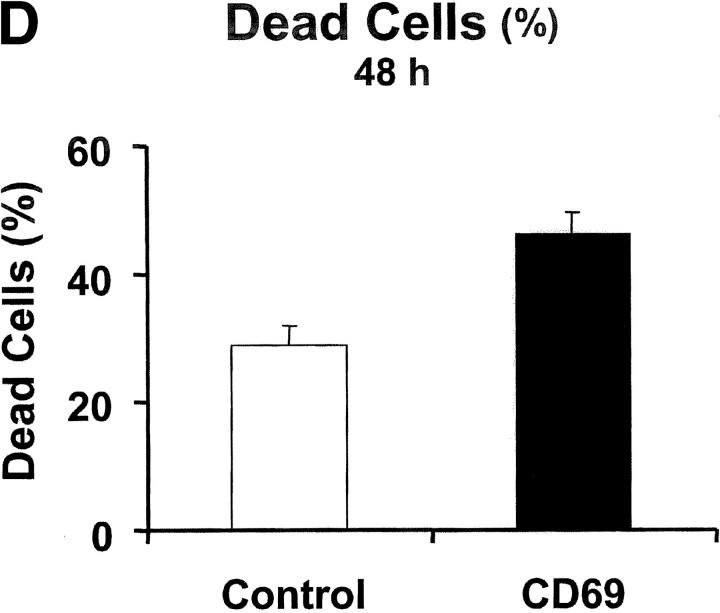
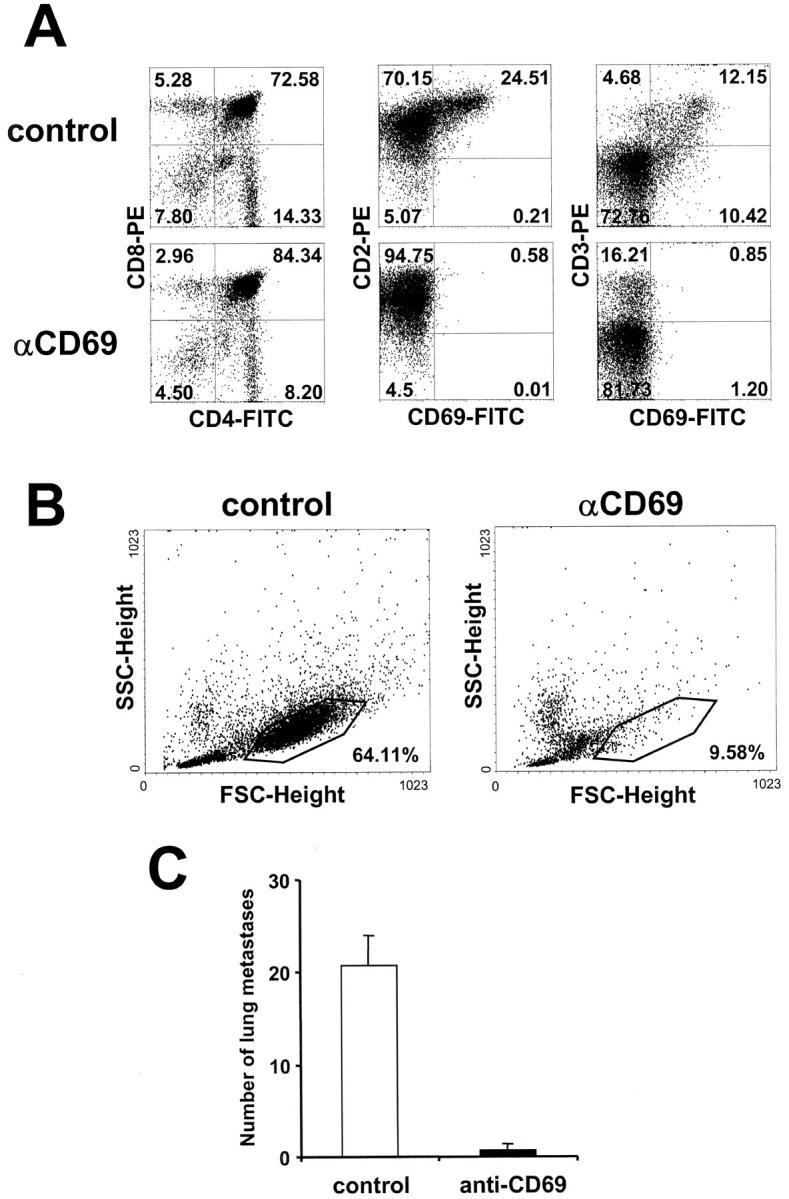
We investigated the in vivo role of CD69 by analyzing the susceptibility of CD69-/- mice to tumors. CD69-/- mice challenged with MHC class I- tumors (RMA-S and RM-1) showed greatly reduced tumor growth and prolonged survival compared with wild-type (WT) mice. The enhanced anti-tumor response was NK cell and T lymphocyte-mediated, and was due, at least in part, to an increase in local lymphocytes. Resistance of CD69-/- mice to MHC class I- tumor growth was also associated with increased production of the chemokine MCP-1, diminished TGF-beta production, and decreased lymphocyte apoptosis. Moreover, the in vivo blockade of TGF-beta in WT mice resulted in enhanced anti-tumor response. In addition, CD69 engagement induced NK and T cell production of TGF-beta, directly linking CD69 signaling to TGF-beta regulation. Furthermore, anti-CD69 antibody treatment in WT mice induced a specific down-regulation in CD69 expression that resulted in augmented anti-tumor response. These data unmask a novel role for CD69 as a negative regulator of anti-tumor responses and show the possibility of a novel approach for the therapy of tumors.


Figures

Figure 1.
Figure 1.
Increased NK anti-tumor activity in CD69−/− mice. Mice were injected intraperitoneally with 104 RMA-S (A) or RMA (C) tumor cells. Mice were observed daily for tumor growth up to 12 wk by monitoring body weight and ascites development. Similar results were observed in mice injected subcutaneously with 105 RMA-S (B). (A, n = 9; B, n = 6; C, n = 9.) (D) NK or T lymphocytes were depleted from CD69−/− mice before intraperitoneal inoculation with 104 RMA-S tumor cells. Mice were treated for NK cell depletion on day −1 (before tumor challenge), and at days +2 and +4 after tumor inoculation with either control diluent or anti–asialo-GM1 antiserum (100 μl/injection). Mice were treated for lymphocyte T CD4+ depletion on day −1 (before tumor challenge), and at days +2 and +4 after tumor inoculation with either GK1.5 anti-CD4 or isotype control mAbs (100 μl/injection). (D, n = 7) Results shown are representative of two independent experiments. (E) Photographs are of lungs from CD69−/− and WT mice 2 wk after the challenge with 104 RM-1 cells intravenous inoculation (top). One representative mouse out of 10 per group is shown. The number of lung metastases were counted (bottom) and each symbol represents one mouse. Open symbols, WT mice; closed symbols, CD69−/− mice. Results are representative of two independent experiments.
Figure 1.
Figure 1.
Increased NK anti-tumor activity in CD69−/− mice. Mice were injected intraperitoneally with 104 RMA-S (A) or RMA (C) tumor cells. Mice were observed daily for tumor growth up to 12 wk by monitoring body weight and ascites development. Similar results were observed in mice injected subcutaneously with 105 RMA-S (B). (A, n = 9; B, n = 6; C, n = 9.) (D) NK or T lymphocytes were depleted from CD69−/− mice before intraperitoneal inoculation with 104 RMA-S tumor cells. Mice were treated for NK cell depletion on day −1 (before tumor challenge), and at days +2 and +4 after tumor inoculation with either control diluent or anti–asialo-GM1 antiserum (100 μl/injection). Mice were treated for lymphocyte T CD4+ depletion on day −1 (before tumor challenge), and at days +2 and +4 after tumor inoculation with either GK1.5 anti-CD4 or isotype control mAbs (100 μl/injection). (D, n = 7) Results shown are representative of two independent experiments. (E) Photographs are of lungs from CD69−/− and WT mice 2 wk after the challenge with 104 RM-1 cells intravenous inoculation (top). One representative mouse out of 10 per group is shown. The number of lung metastases were counted (bottom) and each symbol represents one mouse. Open symbols, WT mice; closed symbols, CD69−/− mice. Results are representative of two independent experiments.
Figure 2.
Figure 2.
Exacerbated anti–tumor response in CD69−/−RAG-deficient mice. Mice were injected intraperitoneally with 106 RMA-S tumor cells. Total unfractionated peritoneal cells from CD69+/+ and CD69−/−–RAG2−/− mice were examined 72 h after tumor inoculation. Forward and scattered FACS® analysis. Marked gates correspond to RMA-S tumor cells. One representative mouse out of 10 per group is shown. Results shown are representative of two independent experiments (n = 8).
Figure 3.
Figure 3.
Increased ex vivo NK cytotoxicity in CD69−/− mice. Mice received 104 RMA-S (A) or RM-1 cells (B) intraperitoneally 72 h after inoculation, total unfractionated peritoneal cells (A and B) from CD69−/− and WT mice were analyzed for cytotoxicity against YAC target cells. Two animals were used per experimental group (mean ± SE). (C and D) Purified NK cells were used, untreated or treated with IL-2, respectively. (D) Two animals were used per experimental group (mean ± SE). Open symbols, WT; closed symbols, CD69−/−. The results are representative of three similar experiments.
Figure 4.
Figure 4.
Peritoneal cell accumulation in CD69−/− mice in response to MHC class I tumor cells. Mice were injected intraperitoneally with PBS or with 105 RM-1 cells (n = 7, mice/group). Cells collected from the peritoneal lavage were analyzed by FACS® and a Multisizer cell counter, and total leukocyte numbers (×10−6) determined at the indicated times.
Figure 5.
Figure 5.
Similar trafficking of activated CD69−/− and WT CD4+ T cells. Short-term (A) and 24-h (B) trafficking patterns of activated CD69−/− and WT CD4+ T cells do not differ. Distribution of radioactivity in various organs at 1 or 24 h, respectively, after intravenous injection of activated 51Cr-labeled CD4+ T cells. Note the numerical scales for organs shown on the right. Four animals were used per experimental group (bars ± SD).
Figure 6.
Figure 6.
Attenuation of spontaneous cell death of CD69−/− lymphocytes. (A) Unfractionated peritoneal cells of untreated mice were seeded in culture medium and cell survival was measured by PI staining. Values show the percentage of PI+ cells (mean ± SD; n = 3 for each group). Results are representative of three independent experiments. (B) Analysis of intracellular caspase-3 activity of spleen cells from WT (left) and CD69−/− (right) challenge mice (3 d with 105 RM-1). Caspase-3 activation was detected with fluorogenic substrate PhiPhiLux-G1D2. PhiPhiLux staining on FL-1 versus forward scatter channels was displayed. (C) After gating on DX5+ cells from spleen, caspase-3 activity was assayed. At least 100,000 events were collected per sample. Experiments were done twice with four and six mice per group; and similar results were obtained.
Figure 7.
Figure 7.
Altered chemokine and cytokine pattern expression in CD69−/− mice. (A) Relative levels of cytokine and chemokine mRNA in peritoneal cells from CD69−/− (▪) and WT (□) mice were analyzed 3 d after intraperitoneally inoculation of 105 RM-1 cells. Results are expressed in arbitrary densitometric units normalized for the expression of GAPDH or L32 in each sample. Five animals were used per experimental group, and results are representative of four independent experiments. (B) MCP-1 levels in LPS-activated peritoneal cells from thioglycollated-treated CD69−/− and WT mice. Data represent the mean ± SE (n = 4 for each group) of one experiment representative of three independent experiments. *, P < 0.004. (C) Quantitative real-time RT-PCR analysis of mRNA from CD69−/− and WT purified peritoneal macrophages (left) and NK cells (right) obtained from mice after 6 d of 105 i.p. RM-1 challenge. Three animals were used per experimental group, and results are representative of one experiment.
Figure 7.
Figure 7.
Altered chemokine and cytokine pattern expression in CD69−/− mice. (A) Relative levels of cytokine and chemokine mRNA in peritoneal cells from CD69−/− (▪) and WT (□) mice were analyzed 3 d after intraperitoneally inoculation of 105 RM-1 cells. Results are expressed in arbitrary densitometric units normalized for the expression of GAPDH or L32 in each sample. Five animals were used per experimental group, and results are representative of four independent experiments. (B) MCP-1 levels in LPS-activated peritoneal cells from thioglycollated-treated CD69−/− and WT mice. Data represent the mean ± SE (n = 4 for each group) of one experiment representative of three independent experiments. *, P < 0.004. (C) Quantitative real-time RT-PCR analysis of mRNA from CD69−/− and WT purified peritoneal macrophages (left) and NK cells (right) obtained from mice after 6 d of 105 i.p. RM-1 challenge. Three animals were used per experimental group, and results are representative of one experiment.
Figure 8.
Figure 8.
Enhanced anti-tumor activity by blocking anti–TGF-β in WT mice. Survival plot of WT and CD69−/− mice intraperitoneally injected on day 0 with 104 RMA-S cells and treated with either 1D11 anti–TGF-β mAb (500 μg/injection) or PBS on days −3 and −1 (before tumor challenge), and at day +1 and every week after tumor inoculation. (n = 4). Results shown are representative of two independent experiments.
Figure 9.
Figure 9.
CD69 engagement induces TGF-β1 secretion in NK and CD3+ T lymphocytes. Antibody engagement of CD69 induces TGF-β1 secretion in mouse-purified NK and T lymphocytes. Anti-CD69 (CD69.2.2) or the isotypic control (murine IgG1) was added followed by cross-linking with goat anti–mouse IgG antibody. (A) Active (left) and total (right) TGF-β1 were determined in NK cells after 24 h in culture supernatants. (B) Purified resting CD3+ T cells were added to 96-well plates coated with anti-CD3. Expression of CD69 after activation with anti-CD3 were analyzed by staining with FITC–anti-murine CD69 mAb (shaded line) after 24 h of culture. Dotted line represents negative control. (C) Antibody engagement of CD69 induces TGF-β1 secretion in mouse T lymphocytes. Cells were incubated in serum-free medium for 72 h and TGF-β1 was determined by ELISA. Data are expressed as mean ± SD of replicate wells and are representative of three independent experiments. (D) Cultured cells were removed and trypan blue was added. Dead cells (trypan blue positive) was determined after 48 h of culture. Data represent means of triplicate wells (bars ± SD).
Figure 9.
Figure 9.
CD69 engagement induces TGF-β1 secretion in NK and CD3+ T lymphocytes. Antibody engagement of CD69 induces TGF-β1 secretion in mouse-purified NK and T lymphocytes. Anti-CD69 (CD69.2.2) or the isotypic control (murine IgG1) was added followed by cross-linking with goat anti–mouse IgG antibody. (A) Active (left) and total (right) TGF-β1 were determined in NK cells after 24 h in culture supernatants. (B) Purified resting CD3+ T cells were added to 96-well plates coated with anti-CD3. Expression of CD69 after activation with anti-CD3 were analyzed by staining with FITC–anti-murine CD69 mAb (shaded line) after 24 h of culture. Dotted line represents negative control. (C) Antibody engagement of CD69 induces TGF-β1 secretion in mouse T lymphocytes. Cells were incubated in serum-free medium for 72 h and TGF-β1 was determined by ELISA. Data are expressed as mean ± SD of replicate wells and are representative of three independent experiments. (D) Cultured cells were removed and trypan blue was added. Dead cells (trypan blue positive) was determined after 48 h of culture. Data represent means of triplicate wells (bars ± SD).
Figure 10.
Figure 10.
Therapeutic anti-tumor activity of anti-CD69 mAbs. 8-wk-old C57BL/6 mice were treated intraperitoneally with 500 µg anti-CD69.2.2 or with the isotype control (mouse IgG1). (A) Thymocytes were prepared from the treated mice, and were subjected to flow cytometric analysis. Representative profiles of CD4/CD8, CD2/CD69 (10 d after mAb injection), and CD3/CD69 (15 d after mAb injection) are shown with the percentage of cells in each quadrant. (B) Peritoneal cells of WT mice were examined at day 3 after intraperitoneal injection of 106 RMA-S tumor cells. Mice were treated with mAb 1 d before tumor inoculation. Cells collected from the peritoneal lavage were analyzed and forward and scattered FACS® analysis is shown. Marked gates correspond to RMA-S tumor cells. (C) Mice were injected intravenously with 104 RM-1 and were treated with mAb on day −1 (before tumor challenge). Number of lung metastases was counted 14 d after tumor inoculation. (C) Open bar, control mice; closed bar, anti-CD69 mAb treated WT mice (bars ± SD). Results are representative of two independent experiments (n = 3).

Similar articles

Cited by

References

    1. Sanchez-Mateos, P., and F. Sanchez-Madrid. 1991. Structure-function relationship and immunochemical mapping of external and intracellular antigenic sites on the lymphocyte activation inducer molecule, AIM/CD69. Eur. J. Immunol. 21:2317–2325. - PubMed
    1. Sant'Angelo, D.B., B. Lucas, P.G. Waterbury, B. Cohen, T. Brabb, J. Goverman, R.N. Germain, and C.A. Janeway, Jr. 1998. A molecular map of T cell development. Immunity. 9:179–186. - PubMed
    1. Testi, R., D. D'Ambrosio, R. De Maria, and A. Santoni. 1994. The CD69 receptor: a multipurpose cell-surface trigger for hematopoietic cells. Immunol. Today. 15:479–483. - PubMed
    1. Lauzurica, P., D. Sancho, M. Torres, B. Albella, M. Marazuela, T. Merino, J.A. Bueren, A.C. Martinez, and F. Sanchez-Madrid. 2000. Phenotypic and functional characteristics of hematopoietic cell lineages in CD69-deficient mice. Blood. 95:2312–2320. - PubMed
    1. Testi, R., J.H. Phillips, and L.L. Lanier. 1989. T cell activation via Leu-23 (CD69). J. Immunol. 143:1123–1128. - PubMed

Publication types

MeSH terms