Comprehensive epitope analysis of human immunodeficiency virus type 1 (HIV-1)-specific T-cell responses directed against the entire expressed HIV-1 genome demonstrate broadly directed responses, but no correlation to viral load
- PMID: 12525643
- PMCID: PMC140965
- DOI: 10.1128/jvi.77.3.2081-2092.2003
Comprehensive epitope analysis of human immunodeficiency virus type 1 (HIV-1)-specific T-cell responses directed against the entire expressed HIV-1 genome demonstrate broadly directed responses, but no correlation to viral load
Abstract
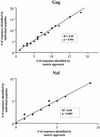
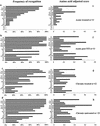
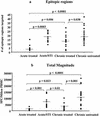
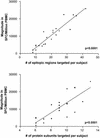
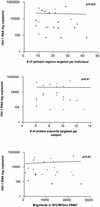
Cellular immune responses play a critical role in the control of human immunodeficiency virus type 1 (HIV-1); however, the breadth of these responses at the single-epitope level has not been comprehensively assessed. We therefore screened peripheral blood mononuclear cells (PBMC) from 57 individuals at different stages of HIV-1 infection for virus-specific T-cell responses using a matrix of 504 overlapping peptides spanning all expressed HIV-1 proteins in a gamma interferon-enzyme-linked immunospot (Elispot) assay. HIV-1-specific T-cell responses were detectable in all study subjects, with a median of 14 individual epitopic regions targeted per person (range, 2 to 42), and all 14 HIV-1 protein subunits were recognized. HIV-1 p24-Gag and Nef contained the highest epitope density and were also the most frequently recognized HIV-1 proteins. The total magnitude of the HIV-1-specific response ranged from 280 to 25,860 spot-forming cells (SFC)/10(6) PBMC (median, 4,245) among all study participants. However, the number of epitopic regions targeted, the protein subunits recognized, and the total magnitude of HIV-1-specific responses varied significantly among the tested individuals, with the strongest and broadest responses detectable in individuals with untreated chronic HIV-1 infection. Neither the breadth nor the magnitude of the total HIV-1-specific CD8+-T-cell responses correlated with plasma viral load. We conclude that a peptide matrix-based Elispot assay allows for rapid, sensitive, specific, and efficient assessment of cellular immune responses directed against the entire expressed HIV-1 genome. These data also suggest that the impact of T-cell responses on control of viral replication cannot be explained by the mere quantification of the magnitude and breadth of the CD8+-T-cell response, even if a comprehensive pan-genome screening approach is applied.
Figures


Similar articles
-
Comprehensive analysis of human immunodeficiency virus type 1-specific CD4 responses reveals marked immunodominance of gag and nef and the presence of broadly recognized peptides.J Virol. 2004 May;78(9):4463-77. doi: 10.1128/jvi.78.9.4463-4477.2004. J Virol. 2004. PMID: 15078927 Free PMC article.
-
Role of human immunodeficiency virus (HIV)-specific T-cell immunity in control of dual HIV-1 and HIV-2 infection.J Virol. 2007 Sep;81(17):9061-71. doi: 10.1128/JVI.00117-07. Epub 2007 Jun 20. J Virol. 2007. PMID: 17582003 Free PMC article.
-
Cytolytic T lymphocytes (CTLs) from HIV-1 subtype C-infected Indian patients recognize CTL epitopes from a conserved immunodominant region of HIV-1 Gag and Nef.J Infect Dis. 2005 Sep 1;192(5):749-59. doi: 10.1086/432547. Epub 2005 Jul 27. J Infect Dis. 2005. PMID: 16088824
-
Comprehensive delineation of antigenic and immunogenic properties of peptides derived from the nef HIV-1 regulatory protein.Vaccine. 1993;11(11):1083-92. doi: 10.1016/0264-410x(93)90066-7. Vaccine. 1993. PMID: 8249426 Review.
-
Cellular immune response to human immunodeficiency virus.AIDS. 2001 Feb;15 Suppl 2:S16-21. doi: 10.1097/00002030-200102002-00004. AIDS. 2001. PMID: 11424972 Review.
Cited by
-
Clinical Control of HIV-1 by Cytotoxic T Cells Specific for Multiple Conserved Epitopes.J Virol. 2015 May;89(10):5330-9. doi: 10.1128/JVI.00020-15. Epub 2015 Mar 4. J Virol. 2015. PMID: 25741000 Free PMC article.
-
T-cell therapies for HIV.Immunotherapy. 2013 Apr;5(4):407-14. doi: 10.2217/imt.13.23. Immunotherapy. 2013. PMID: 23557423 Free PMC article. Review.
-
Unique acquisition of cytotoxic T-lymphocyte escape mutants in infant human immunodeficiency virus type 1 infection.J Virol. 2005 Sep;79(18):12100-5. doi: 10.1128/JVI.79.18.12100-12105.2005. J Virol. 2005. PMID: 16140787 Free PMC article.
-
Synonymous substitution rates predict HIV disease progression as a result of underlying replication dynamics.PLoS Comput Biol. 2007 Feb 16;3(2):e29. doi: 10.1371/journal.pcbi.0030029. Epub 2007 Jan 2. PLoS Comput Biol. 2007. PMID: 17305421 Free PMC article.
-
Durable cytotoxic immune responses against gp120 elicited by recombinant SV40 vectors encoding HIV-1 gp120 +/- IL-15.Genet Vaccines Ther. 2004 Aug 23;2(1):10. doi: 10.1186/1479-0556-2-10. Genet Vaccines Ther. 2004. PMID: 15324456 Free PMC article.
References
-
- Addo, M. M., M. Altfeld, A. Rathod, M. Yu, X. G. Yu, P. J. R. Goulder, E. S. Rosenberg, and B. D. Walker. 2002. HIV-1 Vpu represents a minor target for cytotoxic T lymphocytes (CTL) in HIV-1-infection. AIDS 16:1071-1073. - PubMed
-
- Addo, M. M., M. Altfeld, E. S. Rosenberg, R. L. Eldridge, M. N. Philips, K. Habeeb, A. Khatri, C. Brander, G. K. Robbins, G. P. Mazzara, P. J. Goulder, and B. D. Walker. 2001. The HIV-1 regulatory proteins Tat and Rev are frequently targeted by cytotoxic T lymphocytes derived from HIV-1-infected individuals. Proc. Natl. Acad. Sci. USA 98:1781-1786. - PMC - PubMed
-
- Allen, T. M., D. H. O'Connor, P. Jing, J. L. Dzuris, B. R. Mothe, T. U. Vogel, E. Dunphy, M. E. Liebl, C. Emerson, N. Wilson, K. J. Kunstman, X. Wang, D. B. Allison, A. L. Hughes, R. C. Desrosiers, J. D. Altman, S. M. Wolinsky, A. Sette, and D. I. Watkins. 2000. Tat-specific cytotoxic T lymphocytes select for SIV escape variants during resolution of primary viraemia. Nature 407:386-390. - PubMed
-
- Altfeld, M., M. M. Addo, R. L. Eldridge, X. G. Yu, S. Thomas, A. Khatri, D. Strick, M. N. Phillips, G. B. Cohen, S. A. Islam, S. A. Kalams, C. Brander, P. J. Goulder, E. S. Rosenberg, and B. D. Walker. 2001. Vpr is preferentially targeted by CTL during HIV-1 infection. J. Immunol. 167:2743-2752. - PubMed
-
- Altfeld, M., E. S. Rosenberg, R. Shankarappa, J. S. Mukherjee, F. M. Hecht, R. L. Eldridge, M. M. Addo, S. H. Poon, M. N. Phillips, G. K. Robbins, P. E. Sax, S. Boswell, J. O. Kahn, C. Brander, P. J. Goulder, J. A. Levy, J. I. Mullins, and B. D. Walker. 2001. Cellular immune responses and viral diversity in individuals treated during acute and early HIV-1 infection. J. Exp. Med. 193:169-180. - PMC - PubMed
Publication types
MeSH terms
Substances
Grants and funding
LinkOut - more resources
Full Text Sources
Other Literature Sources
Medical
Research Materials

