. 2002 Aug 5;196(3):303-10.
doi: 10.1084/jem.20020400.

Receptor-mediated immunoglobulin G transport across mucosal barriers in adult life: functional expression of FcRn in the mammalian lung

Affiliations

Receptor-mediated immunoglobulin G transport across mucosal barriers in adult life: functional expression of FcRn in the mammalian lung

Gerburg M Spiekermann et al. J Exp Med. .

Erratum in

  • J Exp Med. 2003 Jun 2;197(11):1601

Abstract

Mucosal secretions of the human gastrointestinal, respiratory, and genital tracts contain the immunoglobulins (Ig)G and secretory IgA (sIgA) that function together in host defense. Exactly how IgG crosses epithelial barriers to function in mucosal immunity remains unknown. Here, we test the idea that the MHC class I-related Fc-receptor, FcRn, transports IgG across the mucosal surface of the human and mouse lung from lumen to serosa. We find that bronchial epithelial cells of the human, nonhuman primate, and mouse, express FcRn in adult-life, and demonstrate FcRn-dependent absorption of a bioactive Fc-fusion protein across the respiratory epithelium of the mouse in vivo. Thus, IgG, like dimeric IgA, can cross epithelial barriers by receptor-mediated transcytosis in adult animals. These data show that mucosal surfaces that express FcRn reabsorb IgG and explain a mechanism by which IgG may act in immune surveillance to retrieve lumenal antigens for processing in the lamina propria or systemically.


Figures

Figure 1.
Figure 1.
Recombinant Epo–Fc fusion proteins form glycosylated di-sulfide linked homodimers that exhibit functional Fc- and Epo-domains. (A) Schematic describing COOH-terminal fusion of human Epo to the Fc fragment of mouse IgG1. Arrows indicate substitutions at amino acid positions essential for Fc binding to FcRn and FcγR receptors as indicated. (B) SDS-PAGE and Western blot analysis of WT and FcRn-binding mutant fusion proteins (IHH) under nonreducing and reducing (DTT) conditions with and without PNGase F treatment. (C and D) Overlaid surface plasmon resonance sensorgrams of mFcRn injected over immobilized Epo–Fc, Epo-Fc/IHH, and Epo–Fc/LLG. mFcRn were injected at concentrations of 1,000 nM, 500 nM, 250 nM, 125 nM, and 62.5 nM at a flow rate of 10 μl/min (decreasing signal levels correspond to decreasing concentrations of mFcRn). Data show representative sensorgrams from duplicate injections, and were processed by zero adjustment and reference cell (blank flow cell) subtraction. Note that the different coupling densities of Epo–Fc (444RU) and Epo–Fc/LLG (2430 RU) result in different signal levels. (E) Reticulocyte fraction induced by intraperitoneal injection of Epo-Fc (0.5 μg/mouse, column 2, n = 3), Epo-Fc/IHH (0.5, 1, or 2 μg/mouse, columns 3, 4, and 5, n = 3 mice per group), or buffer alone (PBS, column 1, n = 15 mice from six independent experiments). Mean ± SEM. *P < 0.05 relative to PBS control.
Figure 1.
Figure 1.
Recombinant Epo–Fc fusion proteins form glycosylated di-sulfide linked homodimers that exhibit functional Fc- and Epo-domains. (A) Schematic describing COOH-terminal fusion of human Epo to the Fc fragment of mouse IgG1. Arrows indicate substitutions at amino acid positions essential for Fc binding to FcRn and FcγR receptors as indicated. (B) SDS-PAGE and Western blot analysis of WT and FcRn-binding mutant fusion proteins (IHH) under nonreducing and reducing (DTT) conditions with and without PNGase F treatment. (C and D) Overlaid surface plasmon resonance sensorgrams of mFcRn injected over immobilized Epo–Fc, Epo-Fc/IHH, and Epo–Fc/LLG. mFcRn were injected at concentrations of 1,000 nM, 500 nM, 250 nM, 125 nM, and 62.5 nM at a flow rate of 10 μl/min (decreasing signal levels correspond to decreasing concentrations of mFcRn). Data show representative sensorgrams from duplicate injections, and were processed by zero adjustment and reference cell (blank flow cell) subtraction. Note that the different coupling densities of Epo–Fc (444RU) and Epo–Fc/LLG (2430 RU) result in different signal levels. (E) Reticulocyte fraction induced by intraperitoneal injection of Epo-Fc (0.5 μg/mouse, column 2, n = 3), Epo-Fc/IHH (0.5, 1, or 2 μg/mouse, columns 3, 4, and 5, n = 3 mice per group), or buffer alone (PBS, column 1, n = 15 mice from six independent experiments). Mean ± SEM. *P < 0.05 relative to PBS control.
Figure 2.
Figure 2.
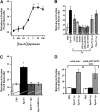
Absorption of Epo–Fc in the intestine of 10-d-old suckling mice depends on FcRn. (A) Dose dependent increase in reticulocyte fraction for Epo–Fc administered intragastrically. One of two representative independent experiments in 10-d-old mice, mean ± SD, n = 2 mice per dose. (B) Reticulocyte fractions induced by i.g. WT Epo–Fc (0.5 μg/mouse, column 2) and Epo–Fc variants containing the indicated mutation(s) in the FcRn- or FγR-binding sites. FcRn mutants were administered twice to account for predicted decrease in serum half-life as discussed in text. Orally administered PBS and intraperitoneally administered Epo–Fc provide negative and positive control. Mean ± SEM, n = 3 mice/group. (C) Reticulocyte fractions induced by i.g. WT Epo–Fc (0.5 μg/mouse) administered with 200-fold excess human IgG (column 3) or with buffer alone (column 2), by Epo–Fc/IHH (1 μg/mouse total, column 4), and by PBS alone (column 1). One of two representative independent experiments, mean ± SEM, n = 3 mice per group. (D) Reticulocyte fractions induced by i.g. Epo–Fc (100 μg/mouse, columns 2 and 5) in adult C57BL/6 (columns 1–3) or homozygous μMT/μMT mice (columns 4–6). Mean ± SEM, n = 3 mice/group. In all panels, *P < 0.05 above PBS-control baseline.
Figure 3.
Figure 3.
Expression of FcRn in bronchial epithelium of human and cynomolgus macaque. (A) SDS-PAGE and Western blot analysis for FcRn in total tissue lysates (170 μg/lane) of adult cynomolgus macaque lung (lanes 1 and 2), adult human lung (lanes 3 and 4), and cultured human intestinal T84 cells as positive control (lanes 5 and 6). Lanes 2, 4, and 6 represent samples treated with PGNase F. (B) SDS-PAGE and Western blot for FcRn in total cell lysates of Calu-3 (lanes 1 and 2), BEAS-2B (lanes 3 and 4), and T84 cell lines as positive control (lanes 5 and 6), with and without PNGase F treatment. Representation of 2 independent experiments. (C) Immunohistochemical staining for FcRn in paraffin sections of adult human bronchus (I) and alveolae (II) and bronchus of adult cynomolgus macaque (III) using a-FcRn specific (left) and nonspecific preimmune antibody as control (right). Original magnification: 20×, representative of three independent experiments.
Figure 3.
Figure 3.
Expression of FcRn in bronchial epithelium of human and cynomolgus macaque. (A) SDS-PAGE and Western blot analysis for FcRn in total tissue lysates (170 μg/lane) of adult cynomolgus macaque lung (lanes 1 and 2), adult human lung (lanes 3 and 4), and cultured human intestinal T84 cells as positive control (lanes 5 and 6). Lanes 2, 4, and 6 represent samples treated with PGNase F. (B) SDS-PAGE and Western blot for FcRn in total cell lysates of Calu-3 (lanes 1 and 2), BEAS-2B (lanes 3 and 4), and T84 cell lines as positive control (lanes 5 and 6), with and without PNGase F treatment. Representation of 2 independent experiments. (C) Immunohistochemical staining for FcRn in paraffin sections of adult human bronchus (I) and alveolae (II) and bronchus of adult cynomolgus macaque (III) using a-FcRn specific (left) and nonspecific preimmune antibody as control (right). Original magnification: 20×, representative of three independent experiments.
Figure 4.
Figure 4.
Expression of FcRn in bronchial epithelium of adult mice. (A) SDS-PAGE and Western blot analysis for FcRn in total tissue lysates (50 μg/lane) of adult mouse lung (lanes 3 and 4), and neonatal mouse intestine (lanes 1 and 2) as positive control. Lanes 2 and 4 represent samples treated with PGNase F. The deglycosylation product is consistent with the hydrolysis of predicted four glycosylation sites in mouse FcRn in contrast to the one glycosylation site in human FcRn as seen in Fig. 3 A. (B) Immunohistochemical staining for FcRn in paraffin sections of adult mouse bronchus using anti-FcRn specific (top) and nonspecific preimmune Ab control (bottom).
Figure 4.
Figure 4.
Expression of FcRn in bronchial epithelium of adult mice. (A) SDS-PAGE and Western blot analysis for FcRn in total tissue lysates (50 μg/lane) of adult mouse lung (lanes 3 and 4), and neonatal mouse intestine (lanes 1 and 2) as positive control. Lanes 2 and 4 represent samples treated with PGNase F. The deglycosylation product is consistent with the hydrolysis of predicted four glycosylation sites in mouse FcRn in contrast to the one glycosylation site in human FcRn as seen in Fig. 3 A. (B) Immunohistochemical staining for FcRn in paraffin sections of adult mouse bronchus using anti-FcRn specific (top) and nonspecific preimmune Ab control (bottom).
Figure 5.
Figure 5.
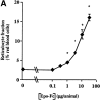
FcRn-specific absorption of Epo–Fc across the epithelial cell barrier of the adult mouse lung in vivo. (A) Dose dependent increase in reticulocyte count for Epo–Fc administered intranasally. Mean ± SEM, six mice per group. *P < 0.05 versus baseline. Maximal response in adult mice ∼17%, see Fig. 2 D. (B) Reticulocyte fractions induced by intranasal administration of fusion proteins containing functional FcRn-binding sites, WT Epo–Fc (column 2) and Epo–Fc/LLG (column 4), by Epo–Fc/IHH that lacks an FcRn-binding site (column 3), and by PBS alone (column 1). All fusion proteins were administered at 10 μg/mouse. Mean ± SEM. n = 5 for all groups except n = 2 for PBS control. *P < 0.05 versus baseline. (C) Absorption of Epo–Fc and Epo–Fc/IHH as assessed directly by ELISA of serum obtained 8 h after nasal administration of fusion proteins at the indicated doses. (D) Reticulocyte fractions induced by intranasal WT Epo–Fc (2 μg, 1 μg, or 0.5 μg/mouse) administered together with 650-, 1,300-, or 2,600-fold excess mouse IgG (g/g, 1.3 mg total dose, light gray bar) 1,300-fold excess chicken IgY (1.3 mg total dose, dark gray bar) or nonspecific protein albumin (1.3 mg total dose, black bars) as competing ligands, and by PBS alone (white bar). Mean ± SEM from two independent experiments *P < 0.05 relative to Epo–Fc plus albumin control. n = 12 mice per group for doses of Epo–Fc 1 μg/mouse and PBS control. n = 6 mice/group for all other doses of Epo–Fc. In the absence of IgG block, absorption of 0.09–0.24 μg of Epo–Fc, or ∼10–18% of the administered dose was detected as assessed by calibration against Epo–Fc injected intravenously (see Supplemental Data).
Figure 5.
Figure 5.
FcRn-specific absorption of Epo–Fc across the epithelial cell barrier of the adult mouse lung in vivo. (A) Dose dependent increase in reticulocyte count for Epo–Fc administered intranasally. Mean ± SEM, six mice per group. *P < 0.05 versus baseline. Maximal response in adult mice ∼17%, see Fig. 2 D. (B) Reticulocyte fractions induced by intranasal administration of fusion proteins containing functional FcRn-binding sites, WT Epo–Fc (column 2) and Epo–Fc/LLG (column 4), by Epo–Fc/IHH that lacks an FcRn-binding site (column 3), and by PBS alone (column 1). All fusion proteins were administered at 10 μg/mouse. Mean ± SEM. n = 5 for all groups except n = 2 for PBS control. *P < 0.05 versus baseline. (C) Absorption of Epo–Fc and Epo–Fc/IHH as assessed directly by ELISA of serum obtained 8 h after nasal administration of fusion proteins at the indicated doses. (D) Reticulocyte fractions induced by intranasal WT Epo–Fc (2 μg, 1 μg, or 0.5 μg/mouse) administered together with 650-, 1,300-, or 2,600-fold excess mouse IgG (g/g, 1.3 mg total dose, light gray bar) 1,300-fold excess chicken IgY (1.3 mg total dose, dark gray bar) or nonspecific protein albumin (1.3 mg total dose, black bars) as competing ligands, and by PBS alone (white bar). Mean ± SEM from two independent experiments *P < 0.05 relative to Epo–Fc plus albumin control. n = 12 mice per group for doses of Epo–Fc 1 μg/mouse and PBS control. n = 6 mice/group for all other doses of Epo–Fc. In the absence of IgG block, absorption of 0.09–0.24 μg of Epo–Fc, or ∼10–18% of the administered dose was detected as assessed by calibration against Epo–Fc injected intravenously (see Supplemental Data).

Similar articles

Cited by

References

    1. Holmgren, J., and A. Rudin. 1999. Mucosal immunity and bacteria. Mucosal Immunology. P.L. Ogra, J. Mestecky, M.E. Lamm, W. Strober, J. Bienenstock and J.R. McGhee, editors. Academic Press, San Diego, CA. pp. 685–693.
    1. Johansen, F.E., M. Pekna, I.N. Norderhaug, B. Haneberg, M.A. Hietala, P. Krajci, C. Betsholtz, and P. Brandtzaeg. 1999. Absence of epithelial immunoglobulin A transport, with increased mucosal leakiness, in polymeric immunoglobulin receptor/secretory component-deficient mice. J. Exp. Med. 190:915–922. - PMC - PubMed
    1. Mahon, B.P., B.J. Sheahan, F. Griffin, G. Murphy, and K.H. Mills. 1997. Atypical disease after Bordetella pertussis respiratory infection of mice with targeted disruptions of interferon-γ receptor or immunoglobulin mu chain genes. J. Exp. Med. 186:1843–1851. - PMC - PubMed
    1. Robert-Guroff, M. 2000. IgG surfaces as an important component in mucosal protection. Nat. Med. 6:129–130. - PubMed
    1. Baba, T.W., V. Liska, R. Hofmann-Lehmann, J. Vlasak, W. Xu, S. Ayehunie, L.A. Cavacini, M.R. Posner, H. Katinger, G. Stiegler, et al. 2000. Human neutralizing monoclonal antibodies of the IgG1 subtype protect against mucosal simian-human immunodeficiency virus infection. Nat. Med. 6:200–206. - PubMed

Publication types