. 2002 Jul;120(1):29-37.
doi: 10.1085/jgp.20028607.

Molecular proximity of Kv1.3 voltage-gated potassium channels and beta(1)-integrins on the plasma membrane of melanoma cells: effects of cell adherence and channel blockers

Affiliations

Molecular proximity of Kv1.3 voltage-gated potassium channels and beta(1)-integrins on the plasma membrane of melanoma cells: effects of cell adherence and channel blockers

Vira V Artym et al. J Gen Physiol. 2002 Jul.

Abstract

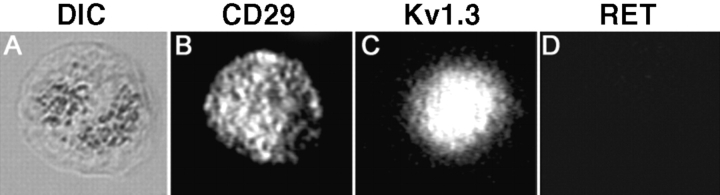
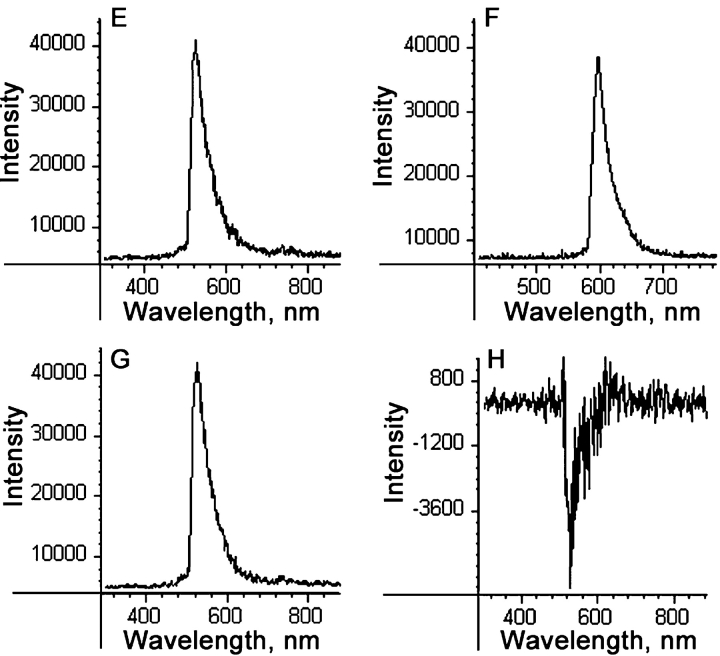
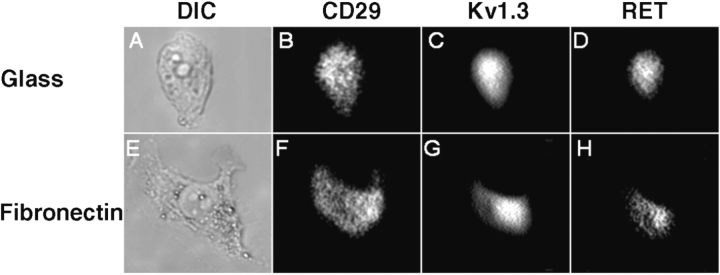
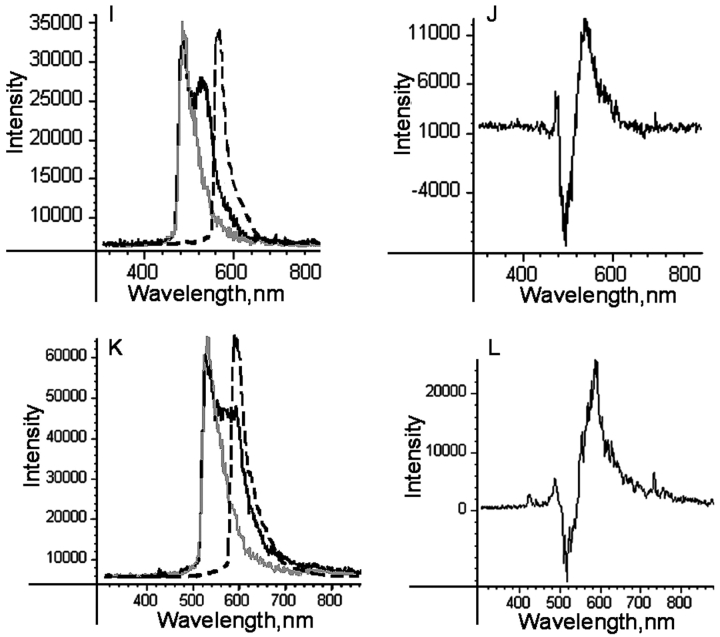
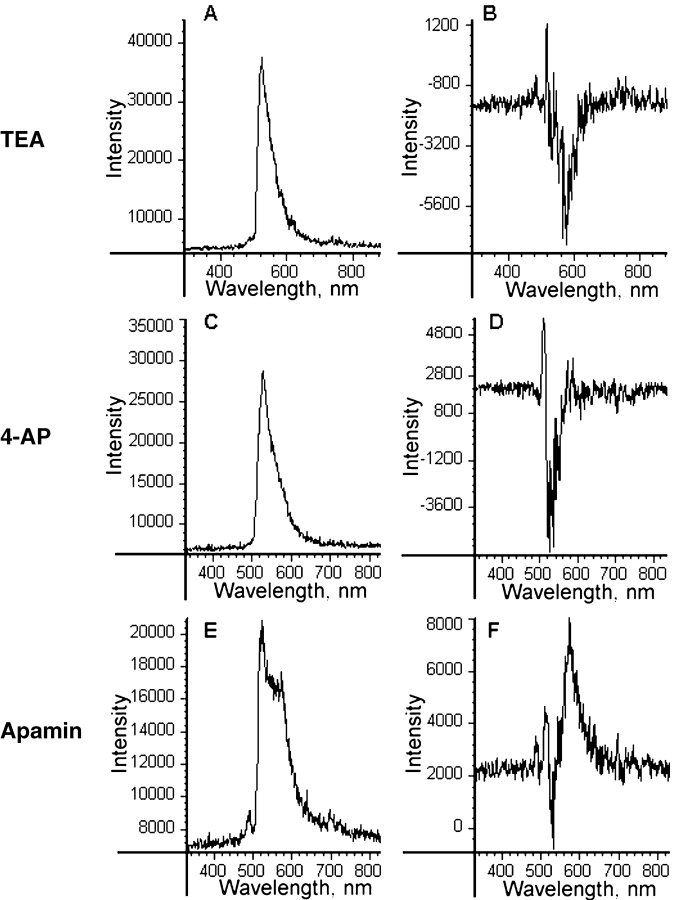
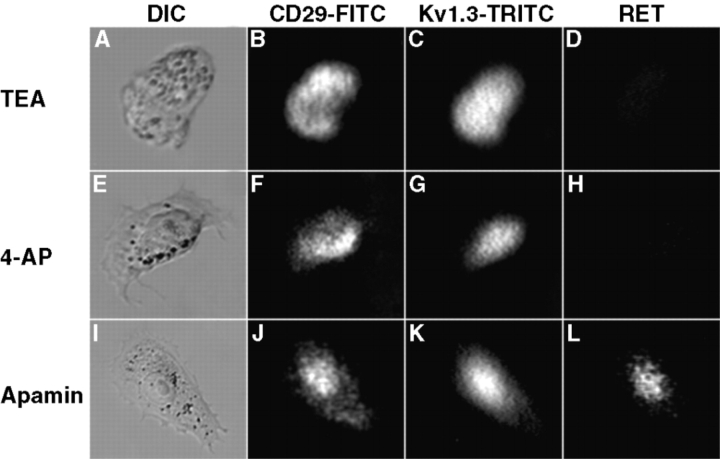
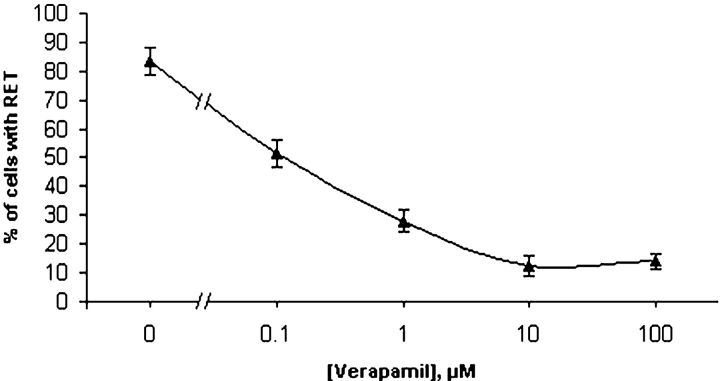
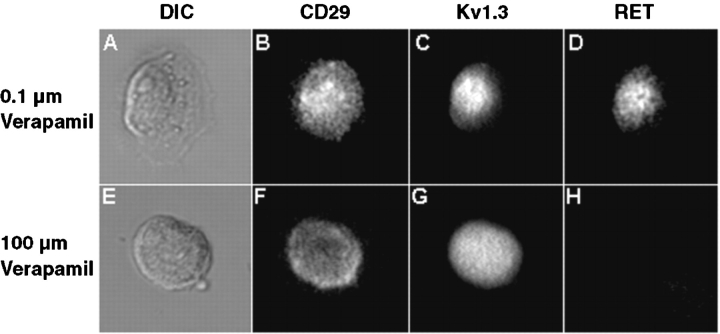
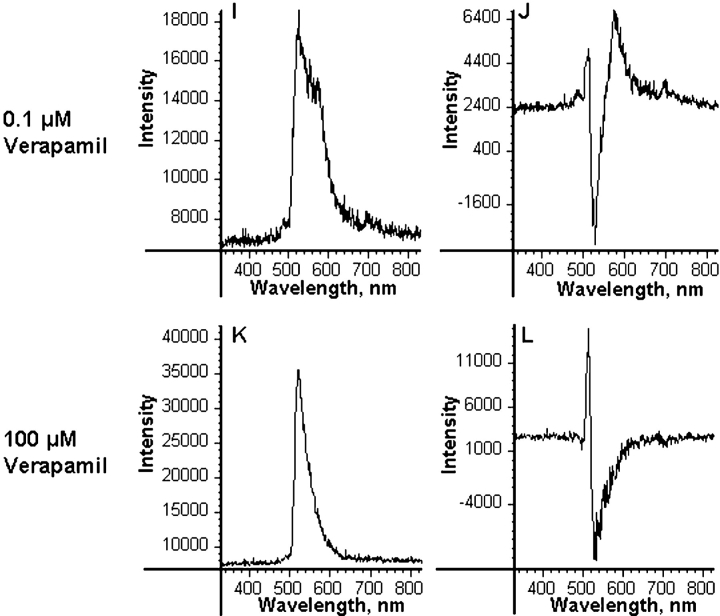
Tumor cell membranes have multiple components that participate in the process of metastasis. The present study investigates the physical association of beta1-integrins and Kv1.3 voltage-gated potassium channels in melanoma cell membranes using resonance energy transfer (RET) techniques. RET between donor-labeled anti-beta1-integrin and acceptor-labeled anti-Kv1.3 channels was detected on LOX cells adherent to glass and fibronectin-coated coverslips. However, RET was not observed on LOX cells in suspension, indicating that molecular proximity of these membrane molecules is adherence-related. Several K(+) channel blockers, including tetraethylammonium, 4-aminopyridine, and verapamil, inhibited RET between beta1-integrins and Kv1.3 channels. However, the irrelevant K(+) channel blocker apamin had no effect on RET between beta1-integrins and Kv1.3 channels. Based on these findings, we speculate that the lateral association of Kv1.3 channels with beta1-integrins contributes to the regulation of integrin function and that channel blockers might affect tumor cell behavior by influencing the assembly of supramolecular structures containing integrins.


Figures

F<sc>igure</sc> 1.
Figure 1.
An absence of RET between β1 integrins (CD29) and Kv1.3 potassium channels on LOX cells in suspension as determined by RET imaging and microspectrophotometry. (A–D) Representative immunofluorescence microscopy experiments of nonadherent cells labeled with anti-CD29 (B) and anti-Kv1.3 (C) are shown. The corresponding DIC image is shown in A. Although cells are labeled with anti-CD29 and anti-Kv1.3 channel reagents, no RET is observed between these labels (D). (E–H) LOX cells in suspension were examined by fluorescence emission microspectrophotometry. The data shown here and elsewhere are plotted as intensity (photon counts) vs. wavelength (nm). LOX cells in suspension were labeled with FITC-conjugated anti-CD29 mAb only (E), first step rabbit anti-Kv1.3 Ab and second step goat anti–rabbit TRITC-conjugated mAb only (F), or both FITC-conjugated anti-CD29 mAb and rabbit anti-Kv1.3 Ab followed with TRITC-conjugated goat anti–rabbit Ab (G). The difference spectrum obtained by mathematical subtraction of anti–β1-integrin FITC (E) from RET spectrum (G) is shown in H. (See text for additional controls.) LOX cells in suspension revealed no RET between β1 integrins and Kv1.3 channels.
F<sc>igure</sc> 2.
Figure 2.
Resonance energy transfer between FITC-labeled β1-integrin and TRITC-labeled Kv1.3 potassium channel on LOX cells adherent to glass or fibronectin-coated coverslips. (A–H) Representative DIC (A and E) and immunofluorescence images of β1-integrin (B and F) and Kv1.3 channel (C and G) labeling on LOX cells adherent to the glass (A–D) and fibronectin-coated (E–H) coverslips. Note the morphological polarization and spreading of the cells in A and E. These cells displayed significant levels of RET (D and H). (I–L) Cells adherent to glass (I and J) or fibronectin (K and L) were examined by fluorescence spectroscopy. Cells were labeled with FITC-conjugated anti–β1-integrin Ab only (gray line in I and K), rabbit anti-Kv1.3 Ab/goat anti–rabbit TRITC-conjugated mAb only (dashed line in I and K), or both anti–β1-integrin and rabbit anti-Kv1.3 Ab/goat anti–rabbit TRITC-conjugated mAb (black line in I and K). Emission RET spectrophotometry detected RET between β1-integrin and Kv1.3 molecules on LOX cells adherent to glass and fibronectin-coated coverslips (appearance of second peak or shoulder in the FITC emission spectra; black lines in I and K). The difference spectra obtained by mathematical subtraction of anti–β1-integrin FITC spectrum (gray line in A and C) from RET spectrum (black line in I and K) represents the RET between integrin and channel. These spectra are shown in J and L for LOX cells adherent to glass or fibronectin-coated coverslips, respectively. (Compare with Fig. 1 H.)
F<sc>igure</sc> 3.
Figure 3.
Inhibition of RET between β1-integrins and Kv1.3 channels by K+ channel blockers. The effect of K+ channel blockers on RET between β1-integrins and Kv1.3 channels was investigated using emission spectrophotometry. LOX cells were allowed to adhere to the fibronectin-coated coverslips at the presence of 10−3 M TEA (A and B), 10−4 M 4-AP (C and D), or 10−9 M apamin (E and F). The cells were fixed then labeled with anti–β1-integrin and anti-Kv1.3 channel antibodies as described above. Representative emission (A, C, and E) and difference (B, D, and F) spectra are shown. RET is absent in cells treated with TEA and 4-AP (A–D). However, RET was observed in the presence of apamin, a K+ channel blocker that has no effect on Kv1.3 channels.
F<sc>igure</sc> 4.
Figure 4.
Inhibitory effect of potassium channel blockers on RET between β1-integrins and Kv1.3 channels. The effect of K+ channel blockers on RET between β1-integrins and Kv1.3 channels was investigated using fluorescence microscopy. LOX cells adherent to the fibronectin-coated coverslips in the presence of 10−3 M TEA (A–D), 10−4 M 4-AP (E–H), or 10−9 M apamin (I–L) were labeled with anti–β1-integrin and anti-Kv1.3 channel reagents. Columns 1–4 show (a) DIC, (b) FITC fluorescence of anti-β1-integrin, (c) TRITC fluorescence of anti-Kv1.3 channel, and (d) RET between these two reagents. Note that although all of the cells were labeled with both reagents, RET was only observed in the presence of apamin.
F<sc>igure</sc> 5.
Figure 5.
Dose-dependent inhibitory effect of verapamil on RET between β1-integrins and Kv1.3 channels. LOX cells were allowed to adhere to fibronectin-coated coverslips at the absence and presence of 0.1 μM to 10 μM verapamil for 2 h. Since cells exposed to 100 μM verapamil could not adhere, experiments at this dose were performed in suspension. The cells were fixed, labeled with anti-β1-integrin and anti-Kv1.3 channel reagents as described, then examined with emission spectrophotometry. The number of cells exhibiting RET were counted and are shown here as a percentage of the total number of cells.
F<sc>igure</sc> 6.
Figure 6.
Effect of verapamil treatment on RET between β1-integrins and Kv1.3 channels. (A–H) Representative DIC (A and E) and immunofluorescence images of β1-integrin (B and F) and Kv1.3 channel (C and G) labeling on LOX cells on fibronectin-coated coverslips in the presence of 0.1 μM (A–D) and 100 μM (E–H) verapamil. These cells displayed significant levels of RET in the presence of 0.1 μM verapamil (D), but not in the presence of 100 μM verapamil (H). (I–L) Spectrophotometry experiments were conducted in the presence of 0.1 μM verapamil (I and J) or 100 μM verapamil (K, L). Cells were labeled as described above. Emission RET spectrophotometry detected RET between β1-integrins and Kv1.3 channels on LOX cells in the presence of 0.1 μM verapamil, but not in the presence of 100 μM verapamil. The difference spectra obtained by mathematical subtraction of anti-β1-integrin FITC spectrum (unpublished data) from the RET spectrum (I) represents the RET between integrin and channel. These spectra are shown in J and L. These data indicate that RET can be observed at doses consistent with binding to calcium channels, but not at doses more consistent with binding to K+ channels.

Similar articles

Cited by

References

    1. Albelda, S.M. 1993. Biology of disease. Role of integrins and other cell adhesion molecules in tumor progression and metastasis. Lab. Invest. 68:4–17. - PubMed
    1. Arcangeli, A., M.R. Del Bene, R. Poli, L. Ricupero, and M. Olivotto. 1989. Mutual contact of murine erythroleukemia cells activates depolarizing cation channels, whereas contact with extracellular substrata activates hyperpolarizing Ca2+-dependent K+ channels. J. Cell. Physiol. 139:1–8. - PubMed
    1. Arcangeli, A., A. Becchetti, M.R. Bene, E. Wanke, and M. Olivotto. 1991. Fibronectin-integrin binding promotes hyperpolarization of murine erythroleukemia cells. Biochem. Biophys. Res. Comm. 177:1266–1272. - PubMed
    1. Arcangeli, A., A. Becchetti, A. Mannini, G. Mugnai, P. De Filippi, G. Tarone, R. Del Bene, E. Barletta, E. Wanke, and M. Olivotto. 1993. Integrin-mediated neurite outgrowth in neuroblastoma cells depends on the activation of potassium channels. J. Cell Biol. 122:1131–1143. - PMC - PubMed
    1. Arcangeli, A., L. Faravelli, L. Bianchi, B. Rosati, A. Gritti, A. Vescovi, E. Wanke, and M. Olivotto. 1996. Soluble or bound laminin elicit in human neuroblastoma cells short- or long-term potentiation of a K+ inwardly rectifying current: relevance to neuritogenesis. Cell Adhes. Commun. 4:369–385. - PubMed

Publication types