. 2002 Feb;22(4):1016-26.
doi: 10.1128/MCB.22.4.1016-1026.2002.

Molecular mechanism of insulin-induced degradation of insulin receptor substrate 1

Affiliations

Molecular mechanism of insulin-induced degradation of insulin receptor substrate 1

Rachel Zhande et al. Mol Cell Biol. 2002 Feb.

Abstract

Insulin receptor substrate 1 (IRS-1) plays an important role in the insulin signaling cascade. In vitro and in vivo studies from many investigators have suggested that lowering of IRS-1 cellular levels may be a mechanism of disordered insulin action (so-called insulin resistance). We previously reported that the protein levels of IRS-1 were selectively regulated by a proteasome degradation pathway in CHO/IR/IRS-1 cells and 3T3-L1 adipocytes during prolonged insulin exposure, whereas IRS-2 was unaffected. We have now studied the signaling events that are involved in activation of the IRS-1 proteasome degradation pathway. Additionally, we have addressed structural elements in IRS-1 versus IRS-2 that are required for its specific proteasome degradation. Using ts20 cells, which express a temperature-sensitive mutant of ubiquitin-activating enzyme E1, ubiquitination of IRS-1 was shown to be a prerequisite for insulin-induced IRS-1 proteasome degradation. Using IRS-1/IRS-2 chimeric proteins, the N-terminal region of IRS-1 including the PH and PTB domains was identified as essential for targeting IRS-1 to the ubiquitin-proteasome degradation pathway. Activation of phosphatidylinositol 3-kinase is necessary but not sufficient for activating and sustaining the IRS-1 ubiquitin-proteasome degradation pathway. In contrast, activation of mTOR is not required for IRS-1 degradation in CHO/IR cells. Thus, our data provide insight into the molecular mechanism of insulin-induced activation of the IRS-1 ubiquitin-proteasome degradation pathway.


Figures
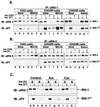
FIG. 1.
FIG. 1.
Degradation of IRS-1 and IRS-2 in CHO, CHO/IR, and CHO/IR/IRS-1 cells. (A and B) CHO and CHO/IR cells were untreated or treated with insulin (Ins, 100 nM) for 12 h in the presence or absence of 25 μM MG132 or 10 μM epoxomicin and rechallenged or not with insulin (100 nM) for 2 min before being lysed. Endogenous IRS-1 and IRS-2 were immunoprecipitated (IP) with αIRS-1 (A) or αIRS-2 (B). (C) CHO/IR/IRS-1 cells were incubated with or without actinomycin (Act., 0.5 μM) or cycloheximide B (Cyc., 0.5 mM) for 30 min before being treated with 100 nM insulin for 8 h or left untreated. Some cells were rechallenged with insulin for 2 min before being lysed in Laemmli sample buffer containing 0.1 M DTT. αIRS-1 and αIRS-2 immune complexes and lysates were separated by SDS-7.5% PAGE and transferred to nitrocellulose membranes. Tyrosine phosphorylation (IRS-1PY or IRS-2PY) and protein levels of IRS-1 and IRS-2 were detected by immunoblotting (IB) analysis using αPY, αIRS-1, and αIRS-2, respectively. These results are representative of at least two experiments.
FIG. 2.
FIG. 2.
Insulin-induced IRS-1 degradation requires the activity of ubiquitin-activating enzyme E1. E36 and ts20 cells overexpressing the human insulin receptor (E36/IR and ts20/IR, respectively) were exposed to nothing or 100 nM insulin for 12 h at 30 or 40°C. Cells were unstimulated or stimulated with insulin for 2 min before being lysed. IRS-1 was immunoprecipitated from lysates with αIRS-1, separated by SDS-7.5% PAGE, and transferred to nitrocellulose membranes. Tyrosine phosphorylation of IRS-1 (IRS-1PY) and protein levels of IRS-1 were detected by immunoblotting analysis with αPY and αIRS-1, respectively. These results are representative of at least two experiments.
FIG. 3.
FIG. 3.
Insulin-induced proteasome degradation of IRS-1 in CHO cells overexpressing the IRA960 mutant. (A) CHO/IR and CHO/IRA960 cells were exposed to various concentrations of insulin for 9.5 h or 10 min, and IRS-1 was immunoprecipitated (IP) from cell lysates with αIRS-1. (B) CHO/IR and CHO/IRA960 cells were exposed to 1 nM insulin for up to 2 h, and IRS-1 was immunoprecipitated from cell lysates with αIRS-1. (C) CHO/IR and CHO/IRA960 cells were exposed to various concentrations of insulin for 10 min, and insulin receptors were immunoprecipitated from cell lysates with αIRβ. Immunoprecipitated IRS-1 or insulin receptor were separated by SDS-7.5% PAGE and transferred to nitrocellulose membranes. Protein levels of IRS-1 and insulin receptor and their tyrosine phosphorylation were detected by immunoblotting analysis using αIRS-1, αIRβ, and αPY, respectively.
FIG. 4.
FIG. 4.
Insulin-induced degradation of the IRS-1F18 mutant in CHO/IR cells. (A) CHO/IR, CHO/IR/IRS-1, and CHO/IR/IRS-1F18 cells were exposed to nothing or 100 nM insulin for 12 h. Cells were unstimulated or stimulated with insulin for 2 min before being lysed in Laemmli sample buffer containing 0.1 M DTT. Proteins were separated on SDS-7.5% PAGE and transferred to nitrocellulose membranes, which were then immunoblotted with αIRS-1 or αPY. The results are representative of six experiments. Three Western blots were scanned and quantified using NIH Image ver. 1.62. Results for αIRS-1: 538 ± 141, 260 ± 119, 4 ± 3, 8 ± 8, 5,956 ± 648, 5,063 ± 724, 489 ± 58, 264 ± 109, 6,704 ± 216, 6,441 ± 382, 212 ± 106, and 180 ± 95. Results for αPY: 120 ± 16, 3,123 ± 304, 123 ± 65, 137 ± 69, 185 ± 85, 6126 ± 275, 372 ± 57, 353 ± 55, 181 ± 58, 2,972 ± 215, 165 ± 54, and 165 ± 76. (B) CHO/IR/IRS-1F18, CHO/IR/IRS-1, CHO/IR, and CHO/IRA960 cells were unstimulated or stimulated with 100 nM insulin for 10 min. IRS-1 was immunoprecipitated from cell lysates by αIRS-1, and PI 3-kinase activity was measured in IRS-1 immune complexes. The results are representative of three experiments.
FIG. 5.
FIG. 5.
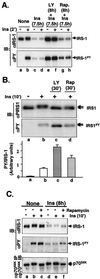
Effect of inhibitors on the insulin-induced degradation of IRS-1. (A) CHO/IR/IRS-1 cells were untreated or treated with LY294002 (LY, 50 μM) or rapamycin (Rap., 200 nM) for 30 min before being exposed to insulin (Ins, 100 nM) for 7.5 h. Cells were rechallenged with insulin for 2 min or not, lysed in Laemmli sample buffer containing 0.1 M DTT, separated by SDS-7.5% PAGE, and transferred to nitrocellulose membranes. IRS-1 and tyrosyl-phosphorylated IRS-1 were detected by immunoblotting (IB) analysis using αIRS-1 and αPY, respectively. (B) CHO/IR/IRS-1 cells were untreated or treated with LY294002 (50 μM) or rapamycin (200 nM) for 30 min, followed by 100 nM insulin for 10 min before being lysed. Proteins were separated by SDS-6% PAGE, and transferred to nitrocellulose membranes. Tyrosine phosphorylation (IRS-1PY) and levels of IRS-1 protein were detected by immunoblotting analysis using αPY and αIRS-1, respectively. Mobility shifts of IRS-1 are indicated by arrows. In the lower panel, Western blots from three separate experiments were scanned and quantified by NIH image ver. 1.62. The data are expressed as a density ratio of phospho-IRS-1 to IRS-1 protein. The standard deviation is indicated. (C) CHO/IR/IRS-1 cells were untreated or treated with 200 nM rapamycin for 30 min, followed by exposure to nothing or 100 nM insulin for 8 h. Cells were rechallenged with 100 nM insulin for 10 min or not before being lysed. IRS-1 and phosphorylated IRS-1 were immunoblotted with αIRS-1 and αPY, respectively (upper and middle panels), and p70 S6K was immunoprecipitated with αp70S6K and immunoblotted with αp70S6K (lower panel).
FIG. 6.
FIG. 6.
Effect of LY294002 on IRS-1 degradation in pre-insulin-activated cells. CHO/IR/IRS-1 cells were exposed to nothing (lanes a and b) or 100 nM insulin for 9 h (lanes c, h, j, and l); to some cells, LY294002 (50 μM) was added after 30 min (lane l), 2 h (lane j), or 5 h (lane h) of insulin exposure. Control cells were exposed to LY294002 alone for 4, 7, or 8.5 h (lanes d to f) or to insulin alone for 30 min (lane k), 2 h (lane i), or 5 h (lane g). At the end of the incubation, cells were stimulated with 100 nM insulin for 2 min (lanes b to l) before being lysed in Laemmli sample buffer containing 0.1 M DTT. Proteins were separated by SDS-6% PAGE and transferred to nitrocellulose membranes. Protein levels and tyrosyl phosphorylation of IRS-1 were detected by immunoblotting analysis with αIRS-1 and αPY, respectively. The results are representative of two experiments.
FIG. 7.
FIG. 7.
Effect of 10% fetal bovine serum on activation of PI 3-kinase, Akt, and IRS-1 degradation. (A) CHO/IR/IRS-1/HA-Akt cells were stimulated with nothing, 10% fetal bovine serum, 100 nM insulin, or 10% fetal bovine serum plus 100 nM insulin for 8 h and rechallenged with nothing, 10% fetal bovine serum, 100 nM insulin, or 10% fetal bovine serum plus 100 nM insulin for 2 min before being lysed. Protein levels and tyrosyl phosphorylation of IRS-1 were measured by immunoblotting analysis with αIRS-1 and αPY, respectively. (B and C) CHO/IR/IRS-1/HA-Akt cells were stimulated with nothing, 10% fetal bovine serum, or 100 nM insulin for 10 min and lysed in lysate buffer. PI 3-kinase activity was measured in αPY immune complexes (B). Phosphorylation of Akt at serine473 and protein levels of Akt were measured in the lysates by immunoblotting analysis with αphosphoAkt and αHA, respectively (C). Results are representative of at least three experiments.
FIG. 8.
FIG. 8.
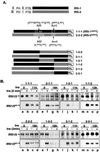
Insulin-induced degradation of IRS-1/IRS-2 chimeric proteins. (A) Construction of IRS-1/IRS-2 chimeras. A His6 tag was first inserted into the C terminus of IRS-1 and IRS-2, resulting in IRS-1CH, and IRS-2CH. AflII and AvrII restriction sites were then introduced into the IRS-1CH and IRS-2CH cDNAs at similar positions by PCR-based site-directed mutagenesis, resulting in IRS-1AACH and IRS-2 AACH. IRS-1AACH and IRS-2 AACH were digested with AflII and/or AvrII, and fragments were isolated and religased in all combinations to create six chimeras with each fragment similar to its original position. Each chimera was given a code, indicated on the right. (B) CHO/IR/chimera cells were exposed to 100 nM insulin or nothing for the indicated times and rechallenged with 100 nM insulin for 2 min before being lysed in Laemmli sample buffer containing 0.1 M DTT. Proteins were separated by SDS-7.5% PAGE and transferred to nitrocellulose membranes. The protein levels of the chimeras were detected by immunoblotting analysis with α-His tag antibody and tyrosyl phosphorylation with αPY. The results are representative of at least two experiments.

Similar articles

Cited by

References

    1. Anai, M., M. Funaki, T. Ogihara, J. Terasaki, K. Inukai, H. Katagiri, Y. Fukushima, Y. Yazaki, M. Kikuchi, Y. Oka, and T. Asano. 1998. Altered expression levels and impaired steps in the pathway to phosphatidylinositol 3-kinase activation via insulin receptor substrates 1 and 2 in Zucker fatty rats. Diabetes 47:13-23. - PubMed
    1. Aoki, M., E. Blazek, and P. K. Vogt. 2001. A role of the kinase mTOR in cellular transformation induced by the oncoproteins P3k and Akt. Proc. Natl. Acad. Sci. USA 98:136-141. - PMC - PubMed
    1. Araki, E., M. A. Lipes, M. E. Patti, J. C. Bruning, B. Haag, 3rd, R. S. Johnson, and C. R. Kahn. 1994. Alternative pathway of insulin signalling in mice with targeted disruption of the IRS-1 gene. Nature 372:186-190. - PubMed
    1. Backer, J. M., M. G. Myers, Jr., S. E. Shoelson, D. J. Chin, X. J. Sun, M. Miralpeix, P. Hu, B. Margolis, E. Y. Skolnik, J. Schlessinger, and M. F. White. 1992. Phosphatidylinositol 3"-kinase is activated by association with IRS-1 during insulin stimulation. EMBO J. 11:3469-3479. - PMC - PubMed
    1. Backer, J. M., M. G. Myers, Jr., X. J. Sun, D. J. Chin, S. E. Shoelson, M. Miralpeix, and M. F. White. 1993. Association of IRS-1 with the insulin receptor and the phosphatidylinositol 3"-kinase. Formation of binary and ternary signaling complexes in intact cells. J. Biol. Chem. 268:8204-8212. - PubMed

Publication types

MeSH terms

Substances