Prevention of fat-induced insulin resistance by salicylate
- PMID: 11489937
- PMCID: PMC209353
- DOI: 10.1172/JCI11559
Prevention of fat-induced insulin resistance by salicylate
Abstract
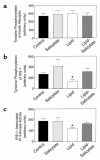
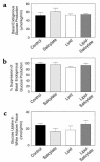
Insulin resistance is a major factor in the pathogenesis of type 2 diabetes and may involve fat-induced activation of a serine kinase cascade involving IKK-beta. To test this hypothesis, we first examined insulin action and signaling in awake rats during hyperinsulinemic-euglycemic clamps after a lipid infusion with or without pretreatment with salicylate, a known inhibitor of IKK-beta. Whole-body glucose uptake and metabolism were estimated using [3-(3)H]glucose infusion, and glucose uptake in individual tissues was estimated using [1-(14)C]2-deoxyglucose injection during the clamp. Here we show that lipid infusion decreased insulin-stimulated glucose uptake and activation of IRS-1-associated PI 3-kinase in skeletal muscle but that salicylate pretreatment prevented these lipid-induced effects. To examine the mechanism of salicylate action, we studied the effects of lipid infusion on insulin action and signaling during the clamp in awake mice lacking IKK-beta. Unlike the response in wild-type mice, IKK-beta knockout mice did not exhibit altered skeletal muscle insulin signaling and action following lipid infusion. In summary, high-dose salicylate and inactivation of IKK-beta prevent fat-induced insulin resistance in skeletal muscle by blocking fat-induced defects in insulin signaling and action and represent a potentially novel class of therapeutic agents for type 2 diabetes.
Figures


Comment in
-
Turning down insulin signaling.J Clin Invest. 2001 Sep;108(5):655-9. doi: 10.1172/JCI13714. J Clin Invest. 2001. PMID: 11544268 Free PMC article. No abstract available.
-
The effect of salicylates on insulin sensitivity.J Clin Invest. 2001 Dec;108(11):1723-4. doi: 10.1172/JCI14455. J Clin Invest. 2001. PMID: 11733568 Free PMC article. No abstract available.
Similar articles
-
Dissociation between fat-induced in vivo insulin resistance and proximal insulin signaling in skeletal muscle in men at risk for type 2 diabetes.J Clin Endocrinol Metab. 2004 Mar;89(3):1301-11. doi: 10.1210/jc.2003-031243. J Clin Endocrinol Metab. 2004. PMID: 15001626 Clinical Trial.
-
PKC-theta knockout mice are protected from fat-induced insulin resistance.J Clin Invest. 2004 Sep;114(6):823-7. doi: 10.1172/JCI22230. J Clin Invest. 2004. PMID: 15372106 Free PMC article.
-
Salicylate prevents hepatic insulin resistance caused by short-term elevation of free fatty acids in vivo.J Endocrinol. 2007 Nov;195(2):323-31. doi: 10.1677/JOE-07-0005. J Endocrinol. 2007. PMID: 17951543
-
Metabolism and insulin signaling in common metabolic disorders and inherited insulin resistance.Dan Med J. 2014 Jul;61(7):B4890. Dan Med J. 2014. PMID: 25123125 Review.
-
Inflammation and the IKK beta/I kappa B/NF-kappa B axis in obesity- and diet-induced insulin resistance.Int J Obes Relat Metab Disord. 2003 Dec;27 Suppl 3:S49-52. doi: 10.1038/sj.ijo.0802501. Int J Obes Relat Metab Disord. 2003. PMID: 14704745 Review.
Cited by
-
Effects of vitamin D treatment on skeletal muscle histology and ultrastructural changes in a rodent model.Molecules. 2012 Jul 31;17(8):9081-9. doi: 10.3390/molecules17089081. Molecules. 2012. PMID: 22850324 Free PMC article.
-
Oleate prevents saturated-fatty-acid-induced ER stress, inflammation and insulin resistance in skeletal muscle cells through an AMPK-dependent mechanism.Diabetologia. 2013 Jun;56(6):1372-82. doi: 10.1007/s00125-013-2867-3. Epub 2013 Mar 5. Diabetologia. 2013. PMID: 23460021
-
A randomised trial of salsalate for insulin resistance and cardiovascular risk factors in persons with abnormal glucose tolerance.Diabetologia. 2013 Apr;56(4):714-23. doi: 10.1007/s00125-012-2819-3. Epub 2013 Jan 31. Diabetologia. 2013. PMID: 23370525 Free PMC article. Clinical Trial.
-
Inflammation and insulin resistance.FEBS Lett. 2008 Jan 9;582(1):97-105. doi: 10.1016/j.febslet.2007.11.057. Epub 2007 Nov 29. FEBS Lett. 2008. PMID: 18053812 Free PMC article. Review.
-
Regulation of stem cell differentiation in adipose tissue by chronic inflammation.Clin Exp Pharmacol Physiol. 2011 Dec;38(12):872-8. doi: 10.1111/j.1440-1681.2011.05596.x. Clin Exp Pharmacol Physiol. 2011. PMID: 21883381 Free PMC article. Review.
References
-
- DeFronzo RA. The triumvirate: beta-cell, muscle, liver. A collusion responsible for NIDDM. Diabetes. 1988;37:667–687. - PubMed
-
- Reaven GM. Role of insulin resistance in human disease. Diabetes. 1988;37:1595–1607. - PubMed
-
- Boden G. Role of fatty acids in the pathogenesis of insulin resistance and NIDDM. Diabetes. 1997;46:3–10. - PubMed
-
- Randle PJ, Garland PB, Hales CN, Newsholme EA. The glucose fatty acid cycle: its role in insulin sensitivity and the metabolic disturbances of diabetes mellitus. Lancet. 1963;1:785–789. - PubMed
Publication types
MeSH terms
Substances
Grants and funding
LinkOut - more resources
Full Text Sources
Other Literature Sources
Medical
Research Materials
Miscellaneous

