. 2001 Jul 23;154(2):369-87.
doi: 10.1083/jcb.200102028.

Vitamin D(3) promotes the differentiation of colon carcinoma cells by the induction of E-cadherin and the inhibition of beta-catenin signaling

Affiliations

Vitamin D(3) promotes the differentiation of colon carcinoma cells by the induction of E-cadherin and the inhibition of beta-catenin signaling

H G Pálmer et al. J Cell Biol. .

Abstract

The beta-catenin signaling pathway is deregulated in nearly all colon cancers. Nonhypercalcemic vitamin D3 (1alpha,25-dehydroxyvitamin D(3)) analogues are candidate drugs to treat this neoplasia. We show that these compounds promote the differentiation of human colon carcinoma SW480 cells expressing vitamin D receptors (VDRs) (SW480-ADH) but not that of a malignant subline (SW480-R) or metastasic derivative (SW620) cells lacking VDR. 1alpha,25(OH)2D(3) induced the expression of E-cadherin and other adhesion proteins (occludin, Zonula occludens [ZO]-1, ZO-2, vinculin) and promoted the translocation of beta-catenin, plakoglobin, and ZO-1 from the nucleus to the plasma membrane. Ligand-activated VDR competed with T cell transcription factor (TCF)-4 for beta-catenin binding. Accordingly, 1alpha,25(OH)2D(3) repressed beta-catenin-TCF-4 transcriptional activity. Moreover, VDR activity was enhanced by ectopic beta-catenin and reduced by TCF-4. Also, 1alpha,25(OH)2D(3) inhibited expression of beta-catenin-TCF-4-responsive genes, c-myc, peroxisome proliferator-activated receptor delta, Tcf-1, and CD44, whereas it induced expression of ZO-1. Our results show that 1alpha,25(OH)2D(3) induces E-cadherin and modulates beta-catenin-TCF-4 target genes in a manner opposite to that of beta-catenin, promoting the differentiation of colon carcinoma cells.


Figures
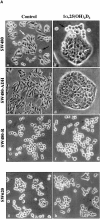
Figure 1.
Figure 1.
Effect of 1α,25(OH)2D3 on human colon carcinoma cells expressing variable levels of VDR. (A) Phase–contrast micrographs of various cell lines upon 48-h treatment with 1α,25(OH)2D3 (10−7 M) or vehicle (control): SW480 (a and b); SW480-ADH (c and d); SW480-R (e and f); SW620 (g and h). The two distinct cell types found in SW480 cultures are indicated in a and b: flat, polygonal, and 1α,25(OH)2D3-sensitive (white arrows), and 1α,25(OH)2D3-rounded 1α,25(OH)2D3-unresponsive (black arrows). (B) Northern blot analysis of VDR and RXRα expression in SW480, SW480-ADH, SW480-R, and SW620 cells untreated or treated with 10−7 M 1α,25(OH)2D3 for 48 h. 10 μg of poly(A)+ RNA was loaded per lane. GAPDH was used as internal control. (C) 1α,25(OH)2D3 transcriptional responsiveness of each cell line. Cells were transfected with the 4 × VDRE–DR3-tk-luc construct and a human VDR expression vector as indicated. After 48-h incubation in the presence or absence of 1α,25(OH)2D3 (10−7 M), luciferase activity in total cell extracts was measured as described in Materials and methods. A β-galactosidase expression vector was also transfected as internal control. Mean values and standard deviations of the mean obtained in three experiments using triplicates are shown. (D) Effect of 1α,25(OH)2D3 on DNA synthesis. Cells were untreated or treated with the indicated 1α,25(OH)2D3 concentrations for 48 h, and the level of DNA synthesis was measured by estimating the incorporation of labeled thymidine in TCA-precipitable material as described in Materials and methods. Mean values and standard deviations of the mean obtained in three experiments using duplicates are shown. ○, SW480 cells; •, SW480-R cells; □, SW480-ADH cells; ▪, SW620 cells.
Figure 1.
Figure 1.
Effect of 1α,25(OH)2D3 on human colon carcinoma cells expressing variable levels of VDR. (A) Phase–contrast micrographs of various cell lines upon 48-h treatment with 1α,25(OH)2D3 (10−7 M) or vehicle (control): SW480 (a and b); SW480-ADH (c and d); SW480-R (e and f); SW620 (g and h). The two distinct cell types found in SW480 cultures are indicated in a and b: flat, polygonal, and 1α,25(OH)2D3-sensitive (white arrows), and 1α,25(OH)2D3-rounded 1α,25(OH)2D3-unresponsive (black arrows). (B) Northern blot analysis of VDR and RXRα expression in SW480, SW480-ADH, SW480-R, and SW620 cells untreated or treated with 10−7 M 1α,25(OH)2D3 for 48 h. 10 μg of poly(A)+ RNA was loaded per lane. GAPDH was used as internal control. (C) 1α,25(OH)2D3 transcriptional responsiveness of each cell line. Cells were transfected with the 4 × VDRE–DR3-tk-luc construct and a human VDR expression vector as indicated. After 48-h incubation in the presence or absence of 1α,25(OH)2D3 (10−7 M), luciferase activity in total cell extracts was measured as described in Materials and methods. A β-galactosidase expression vector was also transfected as internal control. Mean values and standard deviations of the mean obtained in three experiments using triplicates are shown. (D) Effect of 1α,25(OH)2D3 on DNA synthesis. Cells were untreated or treated with the indicated 1α,25(OH)2D3 concentrations for 48 h, and the level of DNA synthesis was measured by estimating the incorporation of labeled thymidine in TCA-precipitable material as described in Materials and methods. Mean values and standard deviations of the mean obtained in three experiments using duplicates are shown. ○, SW480 cells; •, SW480-R cells; □, SW480-ADH cells; ▪, SW620 cells.
Figure 2.
Figure 2.
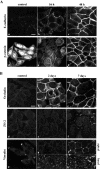
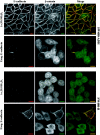
Induction of epithelial markers by 1α,25(OH)2D3 in SW480-ADH cells. (A) Analysis by immunofluorescence and confocal laser scanning microscopy of the expression of various adhesion proteins in cells treated with 10−7 M 1α,25(OH)2D3 for the indicated times or left untreated (control): E-cadherin (a–c); β-catenin (d–f). (B) Same as in A with longer treatments: a–c, occludin; d–f, ZO-2; g–k, vinculin. Vinculin expression was analyzed at two sections: basal (g, i, and k) and apical (h and j). Bars, 10 μm.
Figure 6.
Figure 6.
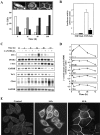
Inhibition of the β-catenin–TCF-4 signaling by 1α,25(OH)2D3. (A) 1α,25(OH)2D3 induces nuclear export of β-catenin. Quantification of the percentage of SW480-ADH cells showing predominant nuclear (left inset, white bars), mixed nuclear-cytoplasmic (middle inset, gray bars), or exclusively membranous (right inset, black bars) β-catenin localization after treatment with 1α,25(OH)2D3 (10−7 M) for the indicated times. 500 cells were analyzed at each time point. (B) Inhibition of β-catenin–TCF-4 transcriptional activity by 1α,25(OH)2D3. SW480-ADH cells were transfected with the wild-type (TOP-flash) or mutated (FOP-flash) β-catenin–TCF4/LEF-1–sensitive reporter plasmids and then left untreated (white bars) or treated (black bars) with 1α,25(OH)2D3 (10−7 M) for 48 h. Mean values and standard deviation of the mean of triplicated obtained in three experiments are shown. (C) Effects of 1α,25(OH)2D3 on the expression of β-catenin–TCF-4 target genes. Northern blots analysis of mRNA expression in SW480-ADH cells untreated or treated with 10−7 M 1α,25(OH)2D3 for the indicated times. Conditions were as above. (D) Quantification of the change in ZO-1, PPARδ, CD44, Tcf-1, and c-myc mRNA levels induced by 1α,25(OH)2D3. Mean values and error bars corresponding to triplicates obtained in three experiments are shown. (E) Induction and redistribution of ZO-1 protein by 1α,25(OH)2D3 treatment. Analysis by immunofluorescence and confocal laser microscopy of ZO-1 expression in SW480-ADH cells after addition of 1α,25(OH)2D3 (10−7 M). Bar, 10 μm.
Figure 3.
Figure 3.
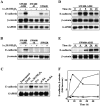
Induction of E-cadherin expression by 1α,25(OH)2D3. (A) Northern blot analysis of E-cadherin and β-catenin mRNA expression in SW480-ADH, SW480-R, and SW620 cells untreated or treated with 10−7 M 1α,25(OH)2D3 for 48 h. 10 μg of poly(A)+ RNA was loaded per lane. GAPDH was used as an internal control. (B) Western blot analysis of E-cadherin and β-catenin protein expression in the same conditions. (C) Specificity of 1α,25(OH)2D3 action. Northern blot analysis of E-cadherin mRNA expression in SW480-ADH cells untreated or treated with 10−7 M of the indicated agent or the corresponding vehicles for 48 h. Conditions were as above. (D) Northern blot analysis of the kinetics of induction of E-cadherin mRNA by 1α,25(OH)2D3 in SW480-ADH cells. Times of treatment are indicated. Conditions were as above. (E) Western blot analysis of the kinetics of induction of E-cadherin protein by 1α,25(OH)2D3 in SW480-ADH cells. Times of treatment are indicated. (F) Quantification of the induction by 1α,25(OH)2D3 in SW480-ADH cells of E-cadherin mRNA (•) and protein (○) and of β-catenin mRNA (▪) and protein (□). Fold increase with respect to expression in untreated cells (time 0) is represented. Mean values of three experiments are shown. Quantifications were performed using NIH image software.
Figure 4.
Figure 4.
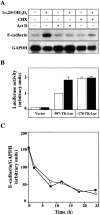
Mechanism of E-cadherin gene induction by 1α,25(OH)2D3. (A) Northern blot analysis of E-cadherin mRNA expression in SW480-ADH cells untreated or treated with 10−7 M 1α,25(OH)2D3 for 4 h. Where indicated, cells were pretreated with actinomycin D (Act D, 2 μg/ml) or cycloheximide (CHX, 8 μg/ml) 30 min before 1α,25(OH)2D3 addition. 10 μg of poly(A)+ RNA was loaded per lane. GAPDH was used as an internal control. (B) Activation of the human E-cadherin gene promoter by 1α,25(OH)2D3. SW480-ADH cells were transfected with either −987-TK-Luc plasmid, which contains the genomic sequence from +92 to −987 bp, or −178-TK-Luc containing the sequence from +92 to −178 bp of the human E-cadherin gene. The empty TK-Luc vector was used as control. Transfections were performed as described in Materials and methods. White bars, untreated cells; black bars, cells treated with 10−7 M 1α,25(OH)2D3 during 48 h after transfection. Mean values corresponding to five independent experiments done in triplicate are shown. (C) Lack of effect of 1α,25(OH)2D3 on E-cadherin mRNA stability. SW480-ADH cells were pretreated or not pretreated for 30 min with actinomycin D (2 μg/ml) and then incubated in the presence (•) or absence (○) of 1α,25(OH)2D3 (10−7 M), during the indicated times. Northern blot analysis of E-cadherin and GAPDH mRNA expression. Conditions were as above. Two independent experiments gave the same result.
Figure 5.
Figure 5.
Induction of colocalization of E-cadherin and β-catenin at the plasma membrane by 1α,25(OH)2D3. Analysis by immunofluorescence and confocal laser scanning microscopy of the expression of these two proteins in SW480-ADH or SW480-R cells at 48 h after either treatment with 1α,25(OH)2D3 (10−7 M) or transfection with an expression vector for human E-cadherin. Double immunofluorescence was performed using anti–E-cadherin and anti–β-catenin antibodies followed by the addition of the corresponding secondary TRICT-conjugated (E-cadherin, red) or FITC-conjugated (β-catenin, green) antibodies. The merge of both signals (yellow) indicates the areas of colocalization of both proteins. Bars, 10 μm.
Figure 7.
Figure 7.
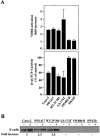
1α,25(OH)2D3 regulates VDR and β-catenin–TCF-4 transcriptional activity and E-cadherin expression in multiple human colon cancer cell lines. (A) Activation of VDR (top) and inhibition of β-catenin–TCF-4 transcriptional activity (bottom) by 1α,25(OH)2D3. Cells were transfected with either the 4 × VDRE–DR3-tk-luc construct (top) or the TOP-flash plasmid (bottom) and then treated or not with 1α,25(OH)2D3 (10−7 M) for 48 h in DME supplemented with 0.5% FCS. SW480-R and SW620 cells were used as negative control. Mean values and standard deviation of the mean of triplicated obtained in two or three experiments after normalization are shown. (B) Effect of the same 1α,25(OH)2D3 treatment on the expression of E-cadherin in the same cell lines. 20 μg of total cell protein extracts (with the exception of 60 μg in the case of LS-174T cells) were analyzed by Western blot. The result shown is representative of two or three experiments performed with each cell line. Quantification of the stimulation by 1α,25(OH)2D3 is shown below.
Figure 8.
Figure 8.
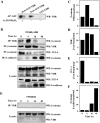
Induction of VDR–β-catenin interaction by 1α,25(OH)2D3. (A) Interaction in vitro. In vitro–translated human VDR and bacterially produced GST– β-catenin were incubated in the presence or absence of 1α,25(OH)2D3 as described in Materials and methods. Western blot (WB) analysis using a specific anti-VDR antibody of the material precipitated upon incubation with GSH–Sepharose beads. GST alone was used in parallel to rule out unspecific binding. (B) Interaction in vivo. Extracts of SW480-ADH cells untreated or treated with 1α,25(OH)2D3 (10−7 M) for the indicated times were subjected to immunoprecipitation (IP) with anti-VDR, or β-catenin, or anti-E-cadherin antibodies followed by Western blot with the antibodies indicated in each case. Western blot analysis showing the proportion of each protein present in the lysates. (C) Quantification of the amount of β-catenin bound to VDR after 1α,25(OH)2D3 addition. (D) Quantification of the amount of VDR bound to β-catenin after 1α,25(OH)2D3 addition. (E) Quantification of the amount of TCF-4 bound to β-catenin after 1α,25(OH)2D3 addition. (F) Quantification of the amount of β-catenin bound to E-cadherin after 1α,25(OH)2D3 addition. (G) Absence of VDR–β-catenin coimmunoprecipita- tion in SW480-R cells. Extracts of SW480-R cells untreated or treated with 1α,25(OH)2D3 (10−7 M) for the indicated times were subjected to immunoprecipitation with anti-VDR antibody followed by Western blotting using anti–β-catenin antibody. Western blot analysis of the lysates show the presence of only residual level of VDR.
Figure 9.
Figure 9.
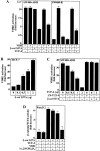
Modulation of the transcriptional activity of VDR by β-catenin and TCF-4. (A) SW480-ADH and SW480-R cells were transfected with the 4 × VDRE–DR3-Tk-Luc construct in combination with expression vectors for VDR, β-catenin S37A, or TCF-4 as indicated. Luciferase activity was measured in extracts of cells untreated or treated with 1α,25(OH)2D3 (10−7 M) for 48 h. (B) β-Catenin enhances VDRE activation in MCF-7 cells. Cells were cotransfected with 4 × VDRE–DR3-Tk-Luc and increasing amounts of β-catenin S37A expression vector. (C) TCF-4 inhibits VDRE activation in SW480-ADH cells. Cells were cotransfected with 4 × VDRE–DR3-Tk-Luc construct and variable amounts of expression vectors for wild-type TCF-4, the mutant ΔN-TCF-4, or β-catenin S37A as indicated. Conditions and measurements were as above. In A–C, VDRE activation is represented as fold increase in treated versus untreated cells. (D) 1α,25(OH)2D3 inhibits β-catenin–TCF-4 transcriptional activity in Pam212 cells. Cells were co-transfected with TOP-flash or FOP-flash reporter constructs and with expression vectors for β-catenin, TCF-4, and VDR as indicated. 1α,25(OH)2D3 (10−7 M) was added 24 h after transfection, and cell extracts were prepared 24 h later. Fold increase values of luciferase activity (TOP/FOP) after normalization were calculated. In A–D, mean values and standard deviation of the mean obtained in duplicates of three independent experiments are shown.
Figure 10.
Figure 10.
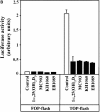
Nonhypercalcemic 1α,25(OH)2D3 derivatives induce E-cadherin and inhibit β-catenin–TCF-4 transcriptional activity in SW480-ADH cells, causing β-catenin nuclear export and morphological differentiation. (A) Northern and Western blot analyses of E-cadherin expression in cells treated for 24 h and 48 h, respectively, with various doses of 1α,25(OH)2D3, MC903, KH1060, or EB1089. Conditions were as above. (B) β-catenin–TCF-4 transcriptional activity in cells transfected with the TOP-flash and FOP-flash constructs and treated 48 h with 10−7 M of the indicated compound. Mean values and standard deviation of the mean obtained in duplicates of two independent experiments are shown. (C) Induction of differentiation and nuclear export of β-catenin. Immunofluorescence and confocal laser microscopy analysis of β-catenin expression was done as before. SW480-R and SW620 cells were used as negative control.
Figure 10.
Figure 10.
Nonhypercalcemic 1α,25(OH)2D3 derivatives induce E-cadherin and inhibit β-catenin–TCF-4 transcriptional activity in SW480-ADH cells, causing β-catenin nuclear export and morphological differentiation. (A) Northern and Western blot analyses of E-cadherin expression in cells treated for 24 h and 48 h, respectively, with various doses of 1α,25(OH)2D3, MC903, KH1060, or EB1089. Conditions were as above. (B) β-catenin–TCF-4 transcriptional activity in cells transfected with the TOP-flash and FOP-flash constructs and treated 48 h with 10−7 M of the indicated compound. Mean values and standard deviation of the mean obtained in duplicates of two independent experiments are shown. (C) Induction of differentiation and nuclear export of β-catenin. Immunofluorescence and confocal laser microscopy analysis of β-catenin expression was done as before. SW480-R and SW620 cells were used as negative control.

Similar articles

Cited by

References

    1. Akhter, J., X. Chen, P. Bowrey, E.J. Bolton, and D.L. Morris. 1997. Vitamin D3 analog, EB1089, inhibits growth of subcutaneous xenographs of the human colon cancer cell line, LoVo, in nude mouse model. Dis. Colon Rec. 40:317–321. - PubMed
    1. Balda, M.S., and K. Matter. 2000. The tight junction protein ZO-1 and an interacting transcription factor regulate ErbB-2 expression. EMBO J. 19:2024–2033. - PMC - PubMed
    1. Batlle, E., E. Sancho, C. Francí, D. Domínguez, M. Monfar, J. Baulida, and A. García de Herreros. 2000. The transcription factor Snail is a repressor of E-cadherin gene expression in epithelial tumor cells. Nat. Cell Biol. 2:84–89. - PubMed
    1. Baulida, J., E. Batlle, and A. García de Herreros. 1999. Adenomatous polyposis coli protein (APC)-independent regulation of β-catenin/Tcf4 mediated transcription in intestinal cells. Biochem. J. 344:565–570. - PMC - PubMed
    1. Behrens, J., J.P. von Kries, M. Külh, L. Bruhn, D. Wedlich, R. Grosschedl, and W. Birchmeier. 1996. Functional interaction of β-catenin with the transcriptional factor LEF-1. Nature. 382:638–642. - PubMed

Publication types

MeSH terms

Substances