. 2001 Jul;21(13):4149-61.
doi: 10.1128/MCB.21.13.4149-4161.2001.

Establishment of an oriP replicon is dependent upon an infrequent, epigenetic event

Affiliations

Establishment of an oriP replicon is dependent upon an infrequent, epigenetic event

E R Leight et al. Mol Cell Biol. 2001 Jul.

Abstract

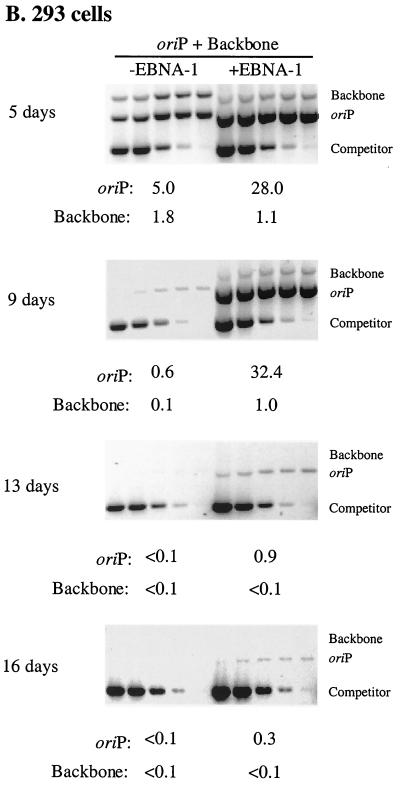
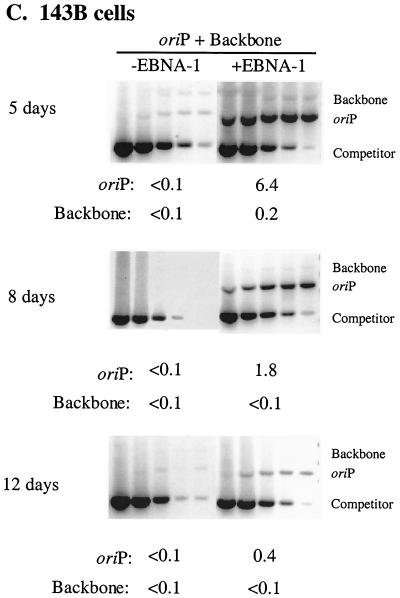
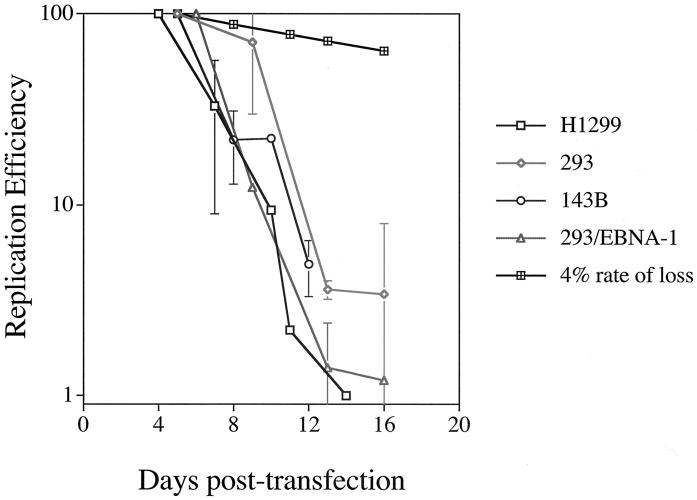
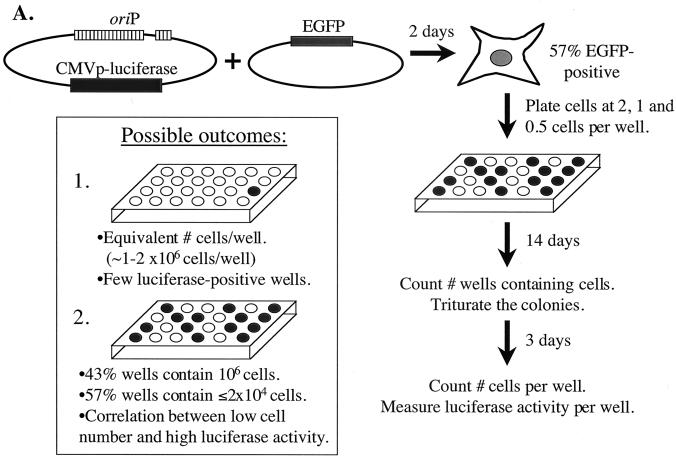
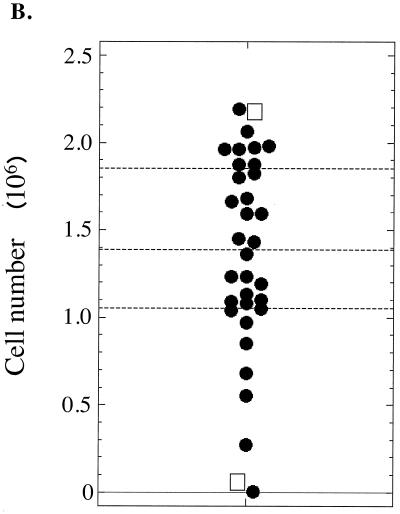
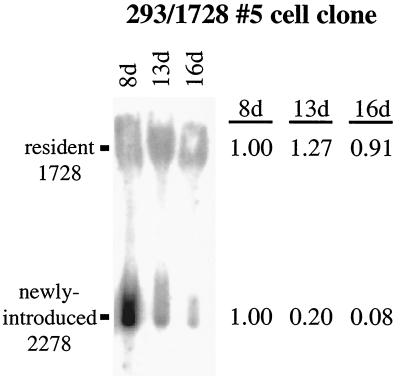
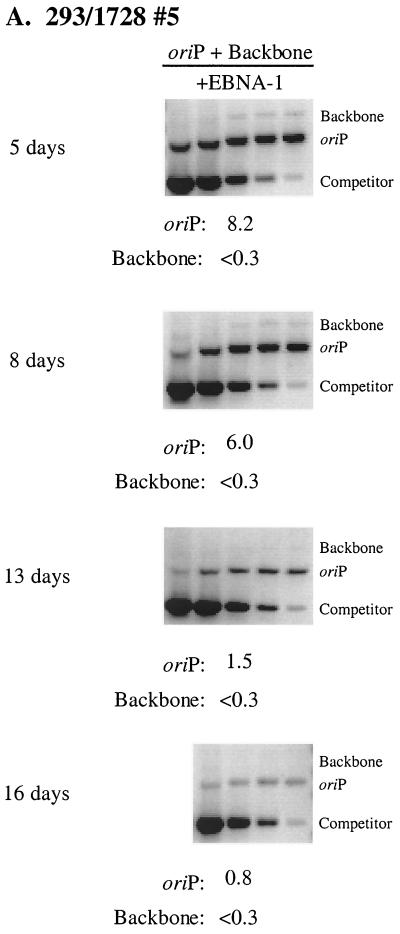
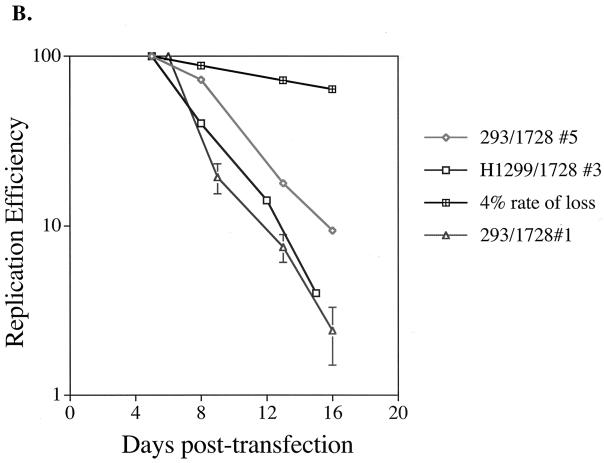
Plasmids containing oriP, the latent origin of replication for Epstein-Barr virus, support efficient replication in selected cell clones when the viral protein EBNA-1 is provided, being lost at a rate of 2 to 4% per cell generation after removal of selection (A. L. Kirchmaier and B. Sugden, J. Virol. 69:1280-1283, 1995; B. Sugden and N. Warren, Mol. Biol. Med. 5:85-94, 1988). We refer to these plasmids as established replicons in that they support efficient DNA synthesis and partitioning each cell cycle. Unexpectedly, we have found that upon introduction of oriP plasmids into a population of EBNA-1-positive cells, oriP plasmids replicate but are lost precipitously from cells during 2 weeks posttransfection (>25% rate of loss per cell generation). Upon investigation of these disparate observations, we have found that only 1 to 10% of cells transfected with an oriP plasmid expressing EBNA-1 and hygromycin phosphotransferase give rise to drug-resistant clones in which the oriP replicon is established. A hereditable alteration in these drug-resistant cell clones, manifested at the genetic or epigenetic level, does not underlie the establishment of oriP, as newly introduced oriP plasmids replicate but are also lost rapidly from these cells. In addition, a genetic alteration in the oriP plasmid is not responsible for establishment, as oriP plasmids isolated from an established cell clone, propagated in Escherichia coli, and reintroduced into EBNA-1-positive cells are likewise established inefficiently. Our findings demonstrate that oriP replicons are not intrinsically stable in EBNA-1-positive cell lines. Rather, the establishment of an oriP replicon is conferred upon the replicon by a stochastic, epigenetic event that occurs infrequently and, therefore, is detected in only a minority of cells.


Figures

FIG. 1
FIG. 1
Newly introduced oriP plasmids replicate within EBNA-1-positive cells but are lost precipitously during 2 weeks posttransfection. Equimolar amounts of oriP test plasmid (oriP) and prokaryotic backbone plasmid (Backbone) were introduced into H1299 (A), 293 (B), and 143B (C) cells with (+EBNA-1) or without (−EBNA-1) an expression plasmid for EBNA-1 and into 293/EBNA-1 cells (D) which stably express EBNA-1. At the indicated time points posttransfection, plasmid DNA was isolated by Hirt extraction and digested with XhoI and DpnI, and the level of replicated, DpnI-resistant DNA was determined by quantitative competitive PCR. PCRs were performed using 105 cell equivalents and a competitor DNA standard curve (9 pg, 3 pg, 600 fg, 120 fg, and 24 fg). Numbers below gels refer to the average number of molecules present per transfected cell. The 143B time course was conducted in duplicate, and gels were rearranged to present a single experiment. The amount of replicated oriP test plasmid present at 6 days posttransfection in 293/EBNA-1 cells was quantified from a separate gel in which 3.3 × 10³ cell equivalents were assayed.
FIG. 1
FIG. 1
Newly introduced oriP plasmids replicate within EBNA-1-positive cells but are lost precipitously during 2 weeks posttransfection. Equimolar amounts of oriP test plasmid (oriP) and prokaryotic backbone plasmid (Backbone) were introduced into H1299 (A), 293 (B), and 143B (C) cells with (+EBNA-1) or without (−EBNA-1) an expression plasmid for EBNA-1 and into 293/EBNA-1 cells (D) which stably express EBNA-1. At the indicated time points posttransfection, plasmid DNA was isolated by Hirt extraction and digested with XhoI and DpnI, and the level of replicated, DpnI-resistant DNA was determined by quantitative competitive PCR. PCRs were performed using 105 cell equivalents and a competitor DNA standard curve (9 pg, 3 pg, 600 fg, 120 fg, and 24 fg). Numbers below gels refer to the average number of molecules present per transfected cell. The 143B time course was conducted in duplicate, and gels were rearranged to present a single experiment. The amount of replicated oriP test plasmid present at 6 days posttransfection in 293/EBNA-1 cells was quantified from a separate gel in which 3.3 × 10³ cell equivalents were assayed.
FIG. 2
FIG. 2
The oriP/EBNA-1 expression plasmid supports replication but is lost precipitously during 2 weeks posttransfection, as is the oriP test plasmid. Equimolar amounts of oriP test plasmid and prokaryotic backbone plasmid were introduced into 293 cells together with 1728, an oriP-based expression plasmid for EBNA-1 (oriP/EBNA-1 expression plasmid). At 5, 9, 13, and 16 days posttransfection (lanes 1 to 4, respectively), plasmid DNA was isolated by Hirt extraction and digested with XhoI and DpnI and the level of replicated, DpnI-resistant DNA was determined by Southern blotting. Approximately 107 cell equivalents were loaded per lane and electrophoresed beside a standard curve of linearized 1728 DNA. The Hirt DNAs ran aberrantly in the gel due to the presence of contaminating chromosomal and mitochondrial DNA. Approximately 5% of chromosomal DNA is present in the Hirt extract (3 μg per 107 cells). The replicated backbone plasmid (indicated by an asterisk) cannot be detected clearly because it migrates with the DpnI-sensitive material near the bottom of the gel.
FIG. 3
FIG. 3
The loss of oriP plasmids from a population of cells during 2 weeks posttransfection varies dramatically from an established oriP-positive cell clone. A graphical representation of multiple, independent time course experiments with H1299 (open boxes), 293 (diamonds), and 143B (circles) cells in which EBNA-1 is provided in trans and 293/EBNA-1 cells (triangles) in which EBNA-1 is expressed stably is shown. Experiments were conducted as described in the legend to Fig. 1. The replication efficiency is plotted versus the days posttransfection. For each independent experiment, the level of replicated oriP test plasmid detected at the first time point posttransfection was set to 100% and the replication efficiency of this plasmid at later time points was set relative to this initial time point. Data for H1299 cells represent the average ± standard deviation of two experiments, except for the 10-day time point, which represents a single experiment, and the 11- and 14-day time points, which represent a second independent experiment. For 293 cells, data represent the average ± standard deviation of three experiments, except for the 13-day time point, which represents two experiments. Data for 143B cells represent the average ± standard deviation of two experiments for the 8- and 12-day time points and a single experiment for the 10- and 16-day time points (16-day data were not plotted but were less than 7% of the replicated oriP test plasmid detected at the 5-day time point). For 293/EBNA-1 cells, data represent the average ± standard deviation of two experiments, except for the 16-day time point, which represents one experiment. A 4% rate of loss, measured for selected cell clones, is depicted by cross-hatched boxes.
FIG. 4
FIG. 4
The precipitous loss of newly introduced oriP plasmids does not result from a selective growth advantage of the untransfected cell population relative to the transfected cell population. (A) The experiment depicted was conducted as described in Results. Given the 57% transfection efficiency, 14 of every 24 wells (plated at one cell/well) should contain the oriP plasmid expressing luciferase, as indicated by dark wells. The inset illustrates two possible outcomes. For outcome 1, with no selective growth advantage of the untransfected cell population, the cells would be expected to undergo 20 to 21 doublings, resulting in 1 × 10⁶ to 2 × 10⁶ cells per well, with approximately 1% of the wells exhibiting high luciferase activity, indicating the loss of oriP plasmids from the majority of the cell population. In outcome 2, the untransfected cell population has a selective growth advantage, so only those untransfected cells (43% of the population) would give rise to 1 × 10⁶ to 2 × 10⁶ cells per well after 17 days. In this scenario, the transfected cells (57% of the population) would give rise to ≤2% of the number of cells of the untransfected population (i.e., ≤2 × 10⁴ cells/well) and would exhibit high luciferase activity per cell. (B) Shown is a dot plot depicting the number of cells which accumulated after 17 days from 34 separate wells. The quartiles are indicated by dashed lines. The transfected and untransfected cells which accumulated after 17 days were similar, with a variance of only 43% (average of 1.35 × 10⁶ ± 5.9 × 10⁵ cells). Two wells contained few cells, with only 3 × 10³ and 5 × 10⁴ cells present. The luciferase activity from each well was normalized to the number of cells present in the well. The two wells containing the highest luciferase activity are indicated by boxes (0.4 RLU/cell for the well containing 2.2 × 10⁶ cells; 2.3 RLU/cell for the well containing 5.3 × 10⁴ cells). According to Kendall's rank correlation test, there is no correlation between low cell number and high luciferase activity (P [two-sided] = 0.79).
FIG. 4
FIG. 4
The precipitous loss of newly introduced oriP plasmids does not result from a selective growth advantage of the untransfected cell population relative to the transfected cell population. (A) The experiment depicted was conducted as described in Results. Given the 57% transfection efficiency, 14 of every 24 wells (plated at one cell/well) should contain the oriP plasmid expressing luciferase, as indicated by dark wells. The inset illustrates two possible outcomes. For outcome 1, with no selective growth advantage of the untransfected cell population, the cells would be expected to undergo 20 to 21 doublings, resulting in 1 × 10⁶ to 2 × 10⁶ cells per well, with approximately 1% of the wells exhibiting high luciferase activity, indicating the loss of oriP plasmids from the majority of the cell population. In outcome 2, the untransfected cell population has a selective growth advantage, so only those untransfected cells (43% of the population) would give rise to 1 × 10⁶ to 2 × 10⁶ cells per well after 17 days. In this scenario, the transfected cells (57% of the population) would give rise to ≤2% of the number of cells of the untransfected population (i.e., ≤2 × 10⁴ cells/well) and would exhibit high luciferase activity per cell. (B) Shown is a dot plot depicting the number of cells which accumulated after 17 days from 34 separate wells. The quartiles are indicated by dashed lines. The transfected and untransfected cells which accumulated after 17 days were similar, with a variance of only 43% (average of 1.35 × 10⁶ ± 5.9 × 10⁵ cells). Two wells contained few cells, with only 3 × 10³ and 5 × 10⁴ cells present. The luciferase activity from each well was normalized to the number of cells present in the well. The two wells containing the highest luciferase activity are indicated by boxes (0.4 RLU/cell for the well containing 2.2 × 10⁶ cells; 2.3 RLU/cell for the well containing 5.3 × 10⁴ cells). According to Kendall's rank correlation test, there is no correlation between low cell number and high luciferase activity (P [two-sided] = 0.79).
FIG. 5
FIG. 5
Replicated, newly introduced oriP plasmids are lost precipitously from an established, oriP-positive cell clone, while resident oriP plasmids are stable. Equimolar amounts of oriP test plasmid (2278) and prokaryotic backbone plasmid (2276) were introduced into the established oriP-positive cell clone 293/1728#5, which harbors the 1728 oriP/EBNA-1 expression plasmid. Plasmid DNA was isolated by Hirt extraction at the indicated time points posttransfection and digested with XhoI and DpnI. The levels of replicated, DpnI-resistant 1728 (resident 1728) and 2278 (newly introduced 2278) were determined by Southern blotting. The level of replicated DNA detected at 8 days posttransfection was set to 1 for each of the two plasmids. The Hirt DNAs ran aberrantly in the gel due to the presence of contaminating chromosomal and mitochondrial DNA. Approximately 5% of chromosomal DNA is present in the Hirt extract (3 μg per 107 cells).
FIG. 6
FIG. 6
Newly introduced oriP plasmids support replication but are lost precipitously in oriP-positive cell clones. (A) The experiment was conducted as described in the legend to Fig. 5. The level of replicated, DpnI-resistant oriP test plasmid (oriP) and prokaryotic backbone plasmid (Backbone) was determined by quantitative competitive PCR. PCRs were performed using 105 cell equivalents and a competitor DNA standard curve (9 pg, 3 pg, 600 fg, 120 fg, 24 fg). Numbers below each gel refer to the average number of molecules present per transfected cell. Note that for the 16-day time point, a PCR mixture containing 9 pg of competitor was not analyzed. (B) Graphical representation of time course experiments in the selected, oriP-positive cell clones 293/1728#5 (diamonds), H1299/1728#3 (boxes), and 293/1728#1 (triangles). Experiments were conducted as described above. For each independent experiment, the level of replicated oriP test plasmid detected at the first time point posttransfection was set to 100%. Data represent a single experiment for the 293/1728#5 and H1299/1728#3 cell clones and three independent experiments for the 293/1728#1 cell clone. A 4% rate of loss is depicted by black cross-hatched boxes.
FIG. 6
FIG. 6
Newly introduced oriP plasmids support replication but are lost precipitously in oriP-positive cell clones. (A) The experiment was conducted as described in the legend to Fig. 5. The level of replicated, DpnI-resistant oriP test plasmid (oriP) and prokaryotic backbone plasmid (Backbone) was determined by quantitative competitive PCR. PCRs were performed using 105 cell equivalents and a competitor DNA standard curve (9 pg, 3 pg, 600 fg, 120 fg, 24 fg). Numbers below each gel refer to the average number of molecules present per transfected cell. Note that for the 16-day time point, a PCR mixture containing 9 pg of competitor was not analyzed. (B) Graphical representation of time course experiments in the selected, oriP-positive cell clones 293/1728#5 (diamonds), H1299/1728#3 (boxes), and 293/1728#1 (triangles). Experiments were conducted as described above. For each independent experiment, the level of replicated oriP test plasmid detected at the first time point posttransfection was set to 100%. Data represent a single experiment for the 293/1728#5 and H1299/1728#3 cell clones and three independent experiments for the 293/1728#1 cell clone. A 4% rate of loss is depicted by black cross-hatched boxes.

Similar articles

Cited by

References

    1. Adams A. Replication of latent Epstein-Barr virus genomes in Raji cells. J Virol. 1987;61:1743–1746. - PMC - PubMed
    1. Aiyar A, Sugden B. Fusions between Epstein-Barr viral nuclear antigen-1 of Epstein-Barr virus and the large T-antigen of simian virus 40 replicate their cognate origins. J Biol Chem. 1998;273:33073–33081. - PubMed
    1. Aiyar A, Tyree C, Sugden B. The plasmid replicon of EBV consists of multiple cis-acting elements that facilitate DNA synthesis by the cell and a viral maintenance element. EMBO J. 1998;17:6394–6403. - PMC - PubMed
    1. Alexandru G, Zachariae W, Schleiffer A, Nasmyth K. Sister chromatid separation and chromosome re-duplication are regulated by different mechanisms in response to spindle damage. EMBO J. 1999;18:2707–2721. - PMC - PubMed
    1. Ambinder R F, Shah W A, Rawlins D R, Hayward G S, Hayward S D. Definition of the sequence requirements for binding of the EBNA-1 protein to its palindromic target sites in Epstein-Barr virus DNA. J Virol. 1990;64:2369–2379. - PMC - PubMed

Publication types

Substances

LinkOut - more resources