. 2001 Jun;75(11):5240-51.
doi: 10.1128/JVI.75.11.5240-5251.2001.

Autostimulation of the Epstein-Barr virus BRLF1 promoter is mediated through consensus Sp1 and Sp3 binding sites

Affiliations

Autostimulation of the Epstein-Barr virus BRLF1 promoter is mediated through consensus Sp1 and Sp3 binding sites

T Ragoczy et al. J Virol. 2001 Jun.

Abstract

As an essential step in the lytic cascade, the Rta homologues of gammaherpesviruses all activate their own expression. Consistent with this biologic function, the Epstein-Barr virus (EBV) Rta protein powerfully stimulates the promoter of its own gene, Rp, in EBV-positive B cells in transient-transfection reporter-based assays. We analyzed the activity of RpCAT in response to Rta by deletional and site-directed mutagenesis. Two cognate Sp1 binding sites located at -279 and -45 relative to the transcriptional start site proved crucial for Rta-mediated activation. Previously described binding sites for the cellular transcription factor Zif268 and the viral transactivator ZEBRA were found to be dispensable for activation of RpCAT by Rta. Gel shift analysis, using extracts of B cells in latency or induced into the lytic cycle, identified Sp1 and Sp3 as the predominant cellular proteins bound to Rp near -45. During the lytic cycle, ZEBRA bound Rp near the Sp1/Sp3 site. The binding of Sp1 and Sp3 to Rp correlated with the reporter activities in the mutagenesis study, establishing a direct link between transcriptional activation of Rp by Rta and DNA binding by Sp1 and/or Sp3. The relative abundance or functional state of the cellular Sp1 and Sp3 transcription factors may be altered in response to stimuli that induce the BRLF1 promoter and thereby contribute to the activation of the viral lytic cycle.


Figures

FIG. 1
FIG. 1
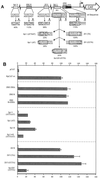
Map of RpCAT. RpCAT reporter construct used for mutagenesis analysis. Boxes and ovals represent previously documented and putative (E-boxes) transcription factor binding sites, respectively (, , , –29). Numbers indicate the positions of the 3′ ends of the cis elements relative to the transcriptional start site (rightward arrow).
FIG. 2
FIG. 2
Effect of deletions on the responsiveness of RpCAT to Rta. (A) Illustration of Rp fragments with 5′ and 3′ truncations used in deletional mutagenesis analysis. Bars represent Rp fragments linked to the CAT reporter. Designations to the left of each bar are relative to the transcriptional start site of Rp, which is indicated by +1. Relative activities of the RpCAT constructs in response to Rta are indicated on the right. (B and C) 5′ deletion analysis of RpCAT in Cl16 cells. (D) 3′ deletions of RpCAT. Average activities of deletion mutants are relative to RpCAT (−299/+58) in the presence of Rta. Cells were transfected with reporter constructs and Rta expression vector (shaded bars) or empty control vector (open bars). CAT activities are standardized to the luciferase activity of a cotransfected HMP+pGL2 construct. Error bars represent the standard error of the mean (n ≥ 2). Below the graph, the fold stimulation of the RpCAT vectors is given (reporter activity in the presence of Rta divided by the reporter activity in the absence of Rta).
FIG. 3
FIG. 3
Effect of point mutations within Sp1 sites, ZEBRA, and Zif268 response elements in Rp on activation by Rta. (A) Site-directed mutations in RpCAT (−299/+58). Boxes represent the response elements, with their names given above and their sequence in the wild-type (wt) promoter given below. The mutated sequences are shown beneath, with the changes indicated in bold. The average activity relative to wild-type −299/+58 is expressed as a percentage below the mutated sequence. The +1 above the rightward arrow above the schematic represents the transcriptional start site of Rp. (B) Average relative activity of RpCAT −299/+58 with site-directed mutations in response to Rta in Cl16 cells. Bars indicate the average activity of RpCAT reporters transfected into Cl16 cells with Rta expression vector (shaded bars) or empty control vector (open bars) and are relative to the wild-type (wt) RpCAT reporter in the presence of Rta (n ≥ 2). Constructs correspond to those illustrated in panel A.
FIG. 4
FIG. 4
Zif268 expression does not correlate with lytic cycle induction in Cl16 cells. Western blot analysis of total cell extracts of Cl16, Jijoye, Raji, and B95-8 cells that were either untreated (U) or treated for 48 h with either TPA (T), sodium butyrate (B), or trichostatin A (A). Immunoblots were probed with antibodies against Rta, Zif268, and ZEBRA.
FIG. 5
FIG. 5
Nucleotide sequence of Cl16 Rp from −70 to −1. Lines above the sequence indicate the extent of documented and putative (E2F1) cis-active response elements of DNA-binding factors. The boxes indicate bases that have been changed in mutant gel shift oligonucleotide probes: CC (−51/−50) → AT (Fig. 8A) and ATGC (−44/−41) → CCTA (Fig. 8B). Below the sequence, the extent of the oligonucleotides used in gel shifts is indicated.
FIG. 6
FIG. 6
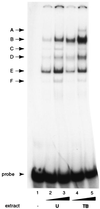
Major protein-DNA complexes formed on Rp −64/−28. EMSA pattern of Cl16 extracts binding to an Rp −64/−28 oligonucleotide. Either 5 or 10 μg of total cell protein from uninduced (U, lanes 2 and 3) and chemically induced with TPA and sodium butyrate (TB, lanes 4 and 5) Cl16 cells were used in the binding reactions. Complexes are labeled with the letters A to F on the left. Probe, free probe. Lane 1, probe alone.
FIG. 7
FIG. 7
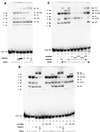
Identification of proteins binding to Rp −64/−28 by antibody supershifts and by oligonucleotide competition. (A) Identification of proteins in uninduced (U) Cl16 extracts binding to the Rp oligonucleotide probe. Complex designation is indicated on the left (B to F); identified proteins are on the right (SS, supershifted bands). Lane 1, probe alone; lanes 2 to 7, 7 μg of cell extract; lanes 3 to 7 contain antiserum to the indicated proteins. (B) Sp1 and ZEBRA occupy Rp −64/−28 together in complex A. Extracts of uninduced cells (U) and of Cl16 cells transfected with ZEBRA and Rta expression vectors (RZ) were incubated with the oligonucleotide probe and the indicated antisera (lanes 3 to 5 and 10 to 12) or a 500-fold excess of the indicated unlabeled competitor DNA (lanes 6 to 8 and 14 to 16). (C) Competition and supershift analysis identify ZEBRA in complex D1 in extracts of induced Cl16 cells. Uninduced (U, lanes 2 and 3) and Rta and ZEBRA-transfected (RZ, lanes 4 to 11) Cl16 extracts were incubated with the Rp probe and Sp3 (lanes 3 and 5 to 10) and ZEBRA (lane 11) antisera. Binding reactions in lanes 6 to 10 also contained a 500-fold excess of the indicated unlabeled competitor DNA (lanes 6 to 9 contained Rp −64/−28, −58/−28, −64/−35, and −58/−35, respectively; lane 10, ZRE ZIIIB).
FIG. 8
FIG. 8
EMSA patterns on mutant oligonucleotides that decrease or enhance the response of Rp to Rta. Uninduced (U) and chemically induced (TB) Cl16 extracts were incubated with mutant oligonucleotide probes AT, which decreases the response to Rta (A), and CCTA, which increases the response to Rta (B). Where indicated, the reaction also included a 100- or 500-fold excess of unlabeled wild-type (wt) or mutant oligonucleotide. Complex designation is indicated on the left (B to F), identified proteins on the right (SS, supershifted bands). (A) Lane 1, probe alone; lanes 2 to 4, uninduced cell extract; lanes 5 to 7, TPA and sodium butyrate-induced cell extracts (TB). Rp −64/−28 was used as the unlabeled competitor at 100- and 500-fold excess in lanes 3, 4, 6, and 7. (B) Lane 1, probe alone; lanes 2 to 6, uninduced cell extract; lanes 7 and 8, TPA and sodium butyrate-induced cell extracts. Rp −64/−28 was used as the unlabeled competitor in lanes 3, 4, and 9; Rp −64/−28 CCTA was used in lanes 5 and 6.
FIG. 9
FIG. 9
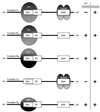
Summary of protein-DNA complexes identified in EMSA experiments. The oligonucleotide probe Rp −64/−28 is illustrated with the overlapping Zif268 and Sp1 binding sites and the ZRE (ZIIIA). Ovals represent the proteins identified in complexes. Complexes A and D1 were identified only in extracts of induced cells; complexes B1/2 and D2 were found in both uninduced and induced cell extracts.
FIG. 10
FIG. 10
Model for autoactivation of Rp by Rta, Sp1, and Sp3. Schematic illustration of the scenario explaining how the expression of Rta could lead to the activation of Rp through Sp1 in a permissive B-cell background such as Cl16 cells. (A) Rp is shown in its silent form during latency on the left and in its activated form on the right. Ovals represent the protein factors Sp1, Sp3, and Rta involved in the repression or activation processes. (B) Potential HDAC repression of Rp. See text for details.

Similar articles

Cited by

References

    1. Ackerman S L, Minden A G, Williams G T, Bobonis C, Yeung C Y. Functional significance of an overlapping consensus binding motif for Sp1 and Zif268 in the murine adenosine deaminase gene promoter. Proc Natl Acad Sci USA. 1991;88:7523–7527. - PMC - PubMed
    1. Alroy I, Soussan L, Seger R, Yarden Y. Neu differentiation factor stimulates phosphorylation and activation of the Sp1 transcription factor. Mol Cell Biol. 1999;19:1961–1972. - PMC - PubMed
    1. Apt D, Watts R M, Suske G, Bernard H U. High Sp1/Sp3 ratios in epithelial cells during epithelial differentiation and cellular transformation correlate with the activation of the HPV-16 promoter. Virology. 1996;224:281–291. - PubMed
    1. Armstrong S A, Barry D A, Leggett R W, Mueller C R. Casein kinase II-mediated phosphorylation of the C terminus of Sp1 decreases its DNA binding activity. J Biol Chem. 1997;272:13489–13495. - PubMed
    1. Babcock G J, Decker L L, Volk M, Thorley-Lawson D A. EBV persistence in memory B cells in vivo. Immunity. 1998;9:395–404. - PubMed

Publication types

MeSH terms