. 2001 Apr;107(7):803-12.
doi: 10.1172/JCI11653.

Attenuation of the self-renewal of transit-amplifying osteoblast progenitors in the murine bone marrow by 17 beta-estradiol

Affiliations

Attenuation of the self-renewal of transit-amplifying osteoblast progenitors in the murine bone marrow by 17 beta-estradiol

G B Di Gregorio et al. J Clin Invest. 2001 Apr.

Abstract

In agreement with evidence that estrogens slow the rate of bone remodeling by suppressing the production of both osteoclasts and osteoblasts, loss of estrogens leads to an increase in the number of osteoclast as well as early osteoblast progenitors (CFU-osteoblasts; CFU-OBs) in the murine bone marrow. Here we show that CFU-OBs are early transit-amplifying progenitors, i.e., dividing cells capable of limited self-renewal, and that 17 beta-estradiol acts in vivo and in vitro to attenuate their self-renewal by approximately 50%. Consistent with a direct receptor-mediated action of estrogens on early mesenchymal cell progenitors, anti-estrogen receptor-alpha (anti-ER alpha) Ab's stain a small number of marrow cells that exhibit characteristics of primitive undifferentiated cells, including a high nucleus/cytoplasm ratio and lack of lineage-specific biochemical markers; the effect of 17 beta-estradiol on CFU-OB self-renewal is absent in mice lacking ER alpha. Because both osteoblasts and the stromal/osteoblastic cells that are required for osteoclast development are derived from CFU-OBs, suppression of the self-renewal of this common progenitor may represent a key mechanism of the anti-remodeling effects of estrogens.


Figures
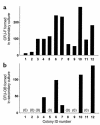
Figure 1
Figure 1
Content of (a) CFU-Fs and (b) CFU-OBs in fibroblastic colonies present in cultures of murine bone marrow cells. Cells were enzymatically dispersed from each of 12 randomly selected fibroblastic colonies (containing greater than 50 cells) that developed in 7-day cultures of femoral marrow cells and assayed for CFU-Fs and CFU-OBs as described in Methods. Bars represent the number of CFU-F or CFU-OB colonies obtained in the secondary culture divided by the fraction of cells used to establish the secondary culture. “0” indicates no colonies detected.
Figure 2
Figure 2
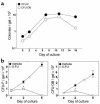
Time kinetics of CFU-F and CFU-OB production by murine bone marrow cells cultured in type I collagen gels. (a) Marrow cell cultures were established in type I collagen gels (10 × 106 cells per gel), and CFU-F and CFU-OB content was assessed either immediately (day 0) or after culture for 2, 7, 11, or 16 days. The data shown represent the mean (± SEM) number of CFU-Fs and CFU-OBs per gel. Preliminary experiments established that the number of CFU-Fs and CFU-OBs in the initial marrow isolate not put into the gel was indistinguishable from the 0 time values (not shown). Error bars are not visible because the symbols are larger than the error bars. Data were analyzed using mixed-effect ANOVA as described in Methods. Significant (P < 0.01) increases in progenitor number versus day 0 were detected at all time points, except for CFU-OBs at day 2. CFU-OB number at day 16 was significantly less than at day 11 (P < 0.05). (b) Marrow cell cultures were established in type I collagen gels as in a without (vehicle) or with 5 μg/ml 5-FU. Progenitor number was then determined after 2 or 5 days of culture. The number of progenitors in the initial isolate (day 0) is expressed per 10 × 106 marrow cells. AP < 0.05 treatment versus vehicle.
Figure 3
Figure 3
Colonies formed from freshly isolated bone marrow progenitors and from progenitors generated in vitro are morphologically indistinguishable. (a) Colonies formed from freshly isolated bone marrow cells. (b) Colonies formed from marrow cells cultured for 5 days in a collagen gel. The left panel of each section shows a 10-cm2 well containing CFU-Fs stained for alkaline phosphatase (top portion) or CFU-OBs stained with von Kossa to detect mineral (bottom portion). The right panel of each section shows a photomicrograph (×2) of a typical alkaline phosphatase–positive CFU-F colony (top portion) and a von Kossa-stained CFU-OB colony (bottom portion).
Figure 4
Figure 4
The time kinetics of colony development and osteoblast differentiation from freshly isolated bone marrow progenitors and from progenitors generated in vitro are identical. (a) Colony histology. Photomicrographs show colonies with a mineralized von Kossa–stained matrix and X-gal–stained blue cells (left panel, ×2; right panel, ×10). Arrows indicate selected X-gal–stained blue cells that are osteoblastic as evidenced by the active OG2 promoter. (b) Kinetics of colony development. Femoral marrow cells were isolated from OG2-lacZ mice and either maintained in culture for 2, 5, 10, 15, 20, or 25 days (left panel) or cultured in type I collagen gels for 6 days and then enzymatically released and cultured for the same period as the freshly isolated cells (right panel). At each time point, cultures were stained with X-gal to detect β-galactosidase–positive cells and according to von Kossa to detect mineral. Colonies comprising at least 50 cells were scored as fibroblastic, β-galactosidase–positive (at least 10 blue cells), or von Kossa–positive. The data shown represent the mean number (± SD) of each type of colony per 106 cells seeded (n = 3 per group). Error bars are not visible days 2 and 5, because the symbol is larger than the error bar. Essentially identical results were obtained in a second experiment.
Figure 5
Figure 5
17β-estradiol attenuates the self-renewal of CFU-OBs. Duplicate cultures of marrow cells in collagen gels (5 × 10⁶ per gel) were maintained in the absence (Veh) or presence of 10–11 to 10–8 M 17β-estradiol (E2) for 6 days and then assayed for CFU-OB content. Assay of freshly isolated marrow cells indicated that there were 90 ± 14 CFU-OBs per 5 × 10⁶ cells used to establish each culture. Thus, there was a 19.2-fold increase in CFU-OBs in cultures maintained in vehicle. The data shown represent the mean (± SEM) of CFU-OBs. AP < 0.05 treatment versus vehicle using mixed-effects ANOVA model. Linear contrast testing indicated a significant (P < 0.05) dose-dependent effect.
Figure 6
Figure 6
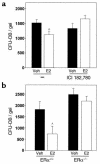
The role of the ER in the suppressive effect of 17β-estradiol on CFU-OB self-renewal. (a) ICI 182,780 blocks the effect of 17β-estradiol. Marrow cell cultures were established in collagen gels (7.5 × 10⁶ per gel) in the absence or presence of 50 nM ICI 182,780. The cultures were maintained for 6 days without (Veh) or with 1 nM 17β-estradiol and then assayed for CFU-OB number. Assay of freshly isolated cells indicated that there were 281 ± 17 CFU-OBs per 7.5 × 10⁶ cells used to establish each culture. Thus, there was a 5.4-fold increase in CFU-OBs in cultures maintained in vehicle in the absence of ICI 182,780. Bars represent the mean number (± SEM) of CFU-OBs per gel. AP < 0.05 treatment versus vehicle as determined by mixed-effects ANOVA. (b) Lack of effect of 17β-estradiol on CFU-OBs from ERα–/– mice. Marrow cells were obtained from ERα+/+ or ERα–/– mice, and collagen gel cultures were established using 8 × 10⁶ cells per gel. Cultures were maintained in the absence or presence of 10 nM 17β-estradiol for 5 days and then assayed for CFU-OBs. Assay of freshly isolated cells from ERα+/+ or ERα–/– mice indicated that there were 248 ± 56 or 384 ± 56 CFU-OBs, respectively, per 8 × 10⁶ cells used to establish each culture. Thus, there was a 7.3-fold (ERα+/+) or 6.5-fold (ERα–/–) increase in CFU-OBs in cultures maintained in vehicle. Bars represent the mean number (± SEM) of progenitors. AP < 0.05 treatment versus vehicle as determined by mixed-effects ANOVA.
Figure 7
Figure 7
Immunocytochemical detection of ERα in cultured murine bone marrow cells. (a) Hematoxylin and eosin (H&E) staining of a fibroblastic colony. The top panel shows a low-power view; bar, 120 μm. The box in the top panel indicates the area shown at high power in the bottom panel; bar, 15 μm. The colonies comprise fibroblast-like cells (arrow) as well as small round cells with high nucleus/cytoplasm ratio (arrowheads). (b) Immunoperoxidase staining (reddish brown) of bone marrow cells with MC-20 or ERnt anti-ERα Ab. Cells incubated with nonimmune rabbit (rIgG) or mouse IgG (mIgG) instead of anti-ERα Ab exhibited no staining. (c) Immunoperoxidase staining of MCF-7 cells (top panels) or HeLa cells (bottom panels) with MC-20 or ERnt Ab. (d) Photomicrographs of the same field taken with fluorescence illumination to visualize ERα-positive cells stained with MC-20 and FITC-labeled anti-rabbit Ab (left panel) and bright-field illumination to visualize alkaline phosphatase–positive (AP-positive) cells (right panel). Arrows indicate position of ERα-positive cells. (e) Photomicrographs of the same field taken with bright-field illumination to visualize ERα-positive cells after immunoperoxidase staining with MC-20 as in b (reddish brown, left panel) and fluorescence illumination to visualize CD11b-positive macrophages detected with FITC (right panel). Arrows indicate position of CD11b-positive cells. be: bars, 15 μm.
Figure 8
Figure 8
Regulation of osteoblast formation by estrogens. Mesenchymal stem cells (white) with high self-renewal capacity (solid arrow) give rise to early transit-amplifying osteoblast progenitors (blue) with limited self-renewal capacity (dashed arrow). The latter differentiate into late transit-amplifying progenitors lacking self-renewal capability (green). Subsequently, late transit-amplifying cells develop into committed osteoblast progenitors (gray) that eventually give rise to fully differentiated osteoblasts (magenta). Estrogens (E2) suppress the self-renewal of early transit-amplifying progenitors. See text for additional details.

Similar articles

Cited by

References

    1. Cosman, F., Dempster, D., and Lindsay, R. 1997. Clinical effects of estrogens and antiestrogens on the skeleton and skeletal metabolism. In Estrogens and antiestrogens. R. Lindsay, D.W. Dempster, and V.C. Jordan, editors. Lippincott-Raven Publishers. Philadelphia, Pennsylvania, USA. 151–164.
    1. Parfitt AM. Osteonal and hemi-osteonal remodeling: the spatial and temporal framework for signal traffic in adult human bone. J Cell Biochem. 1994;55:273–286. - PubMed
    1. Parfitt AM, et al. Relationships between surface, volume and thickness of iliac trabecular bone in aging and in osteoporosis. Implications for the microanatomic and cellular mechanism of bone loss. J Clin Invest. 1983;72:1396–1409. - PMC - PubMed
    1. Eriksen EF, et al. Cancellous bone remodeling in type I (postmenopausal) osteoporosis: quantitative assessment of rates of formation, resorption, and bone loss at tissue and cellular levels. J Bone Miner Res. 1990;5:311–319. - PubMed
    1. Poli V, et al. Interleukin-6 deficient mice are protected from bone loss caused by estrogen depletion. EMBO J. 1994;13:1189–1196. - PMC - PubMed

Publication types