Differential coreceptor expression allows for independent evolution of non-syncytium-inducing and syncytium-inducing HIV-1
- PMID: 11032864
- PMCID: PMC314337
- DOI: 10.1172/JCI7953
Differential coreceptor expression allows for independent evolution of non-syncytium-inducing and syncytium-inducing HIV-1
Erratum in
- J Clin Invest 2000 Dec;106(12):1569
Abstract
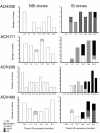
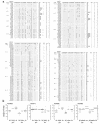
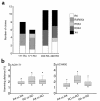
We demonstrated previously that CD45RA(+) CD4(+) T cells are infected primarily by syncytium-inducing (SI) HIV-1 variants, whereas CD45RO(+) CD4(+) T cells harbor both non-SI (NSI) and SI HIV-1 variants. Here, we studied evolution of tropism for CD45RA(+) and CD45RO(+) CD4(+) cells, coreceptor usage, and molecular phylogeny of coexisting NSI and SI HIV-1 clones that were isolated from four patients in the period spanning SI conversion. NSI variants were CCR5-restricted and could be isolated throughout infection from CD45RO(+) CD4(+) cells. SI variants seemed to evolve in CD45RO(+) CD4(+) cells, but, in time, SI HIV-1 infection of CD45RA(+) CD4(+) cells equaled infection of CD45RO(+) CD4(+) cells. In parallel with this shift, SI HIV-1 variants first used both coreceptors CCR5 and CXCR4, but eventually lost the ability to use CCR5. Phylogenetically, NSI and SI HIV-1 populations diverged over time. We observed a differential expression of HIV-1 coreceptors within CD45RA(+) and CD45RO(+) cells, which allowed us to isolate virus from purified CCR5(+) CXCR4(-) and CCR5(-) CXCR4(+) CD4(+) cells. The CCR5(+) subset was exclusively infected by CCR5-dependent HIV-1 clones, whereas SI clones were preferentially isolated from the CXCR4(+) subset. The differential expression of HIV-1 coreceptors provides distinct cellular niches for NSI and SI HIV-1, contributing to their coexistence and independent evolutionary pathways.
Figures


Similar articles
-
In vivo HIV-1 infection of CD45RA(+)CD4(+) T cells is established primarily by syncytium-inducing variants and correlates with the rate of CD4(+) T cell decline.Proc Natl Acad Sci U S A. 2000 Feb 1;97(3):1269-74. doi: 10.1073/pnas.97.3.1269. Proc Natl Acad Sci U S A. 2000. PMID: 10655520 Free PMC article.
-
CCR5 coreceptor usage of non-syncytium-inducing primary HIV-1 is independent of phylogenetically distinct global HIV-1 isolates: delineation of consensus motif in the V3 domain that predicts CCR-5 usage.Virology. 1998 Jan 5;240(1):83-92. doi: 10.1006/viro.1997.8924. Virology. 1998. PMID: 9448692
-
Effects of human immunodeficiency virus type 1 infection on CCR5 and CXCR4 coreceptor expression on CD4 T lymphocyte subsets in infants and adolescents.AIDS Res Hum Retroviruses. 2004 Mar;20(3):305-13. doi: 10.1089/088922204322996545. AIDS Res Hum Retroviruses. 2004. PMID: 15117454
-
Genotypic coreceptor analysis.Eur J Med Res. 2007 Oct 15;12(9):453-62. Eur J Med Res. 2007. PMID: 17933727 Review.
-
Coreceptor usage and biological phenotypes of HIV-1 isolates.Clin Chem Lab Med. 2002 Sep;40(9):911-7. doi: 10.1515/CCLM.2002.160. Clin Chem Lab Med. 2002. PMID: 12435108 Review.
Cited by
-
Comparison of human immunodeficiency virus type 1 tropism profiles in clinical samples by the Trofile and MT-2 assays.Antimicrob Agents Chemother. 2009 Nov;53(11):4686-93. doi: 10.1128/AAC.00229-09. Epub 2009 Aug 17. Antimicrob Agents Chemother. 2009. PMID: 19687240 Free PMC article.
-
Evolution of CCR5 use before and during coreceptor switching.J Virol. 2008 Dec;82(23):11758-66. doi: 10.1128/JVI.01141-08. Epub 2008 Sep 24. J Virol. 2008. PMID: 18815295 Free PMC article.
-
Selection in context: patterns of natural selection in the glycoprotein 120 region of human immunodeficiency virus 1 within infected individuals.Genetics. 2004 Aug;167(4):1547-61. doi: 10.1534/genetics.103.023945. Genetics. 2004. PMID: 15342497 Free PMC article.
-
Differential susceptibility of naïve, central memory and effector memory T cells to dendritic cell-mediated HIV-1 transmission.Retrovirology. 2006 Aug 17;3:52. doi: 10.1186/1742-4690-3-52. Retrovirology. 2006. PMID: 16916447 Free PMC article.
-
Evolution of CXCR4-using human immunodeficiency virus type 1 SF162 is associated with two unique envelope mutations.J Virol. 2007 Apr;81(7):3657-61. doi: 10.1128/JVI.02310-06. Epub 2007 Jan 3. J Virol. 2007. PMID: 17202224 Free PMC article.
References
-
- Ho DD, et al. Rapid turnover of plasma virions and CD4 lymphocytes in HIV-1 infection. Nature. 1995;373:123–126. - PubMed
-
- Wei X, et al. Viral dynamics in human immunodeficiency virus type 1 infection. Nature. 1995;373:117–122. - PubMed
-
- Perelson AS, Neumann AU, Markowitz M, Leonard JM, Ho DD. HIV-1 dynamics in vivo: virion clearance rate, infected cell life-span, and viral generation time. Science. 1996;271:1582–1586. - PubMed
-
- Domingo E, et al. Basic concepts in RNA virus evolution. FASEB J. 1996;10:859–864. - PubMed
-
- Zhu T, et al. Genotypic and phenotypic characterization of HIV-1 in patients with primary infection. Science. 1993;261:1179–1181. - PubMed
Publication types
MeSH terms
Substances
Associated data
- Actions
- Actions
- Actions
- Actions
- Actions
- Actions
- Actions
- Actions
- Actions
- Actions
- Actions
- Actions
- Actions
- Actions
- Actions
- Actions
- Actions
- Actions
- Actions
- Actions
- Actions
- Actions
- Actions
- Actions
- Actions
- Actions
- Actions
- Actions
- Actions
- Actions
LinkOut - more resources
Full Text Sources
Other Literature Sources
Medical
Molecular Biology Databases
Research Materials

