

Ca2+ channels at the plasma membrane of stomatal guard cells are activated by hyperpolarization and abscisic acid
- PMID: 10781106
- PMCID: PMC18341
- DOI: 10.1073/pnas.080068897
Ca2+ channels at the plasma membrane of stomatal guard cells are activated by hyperpolarization and abscisic acid
Abstract
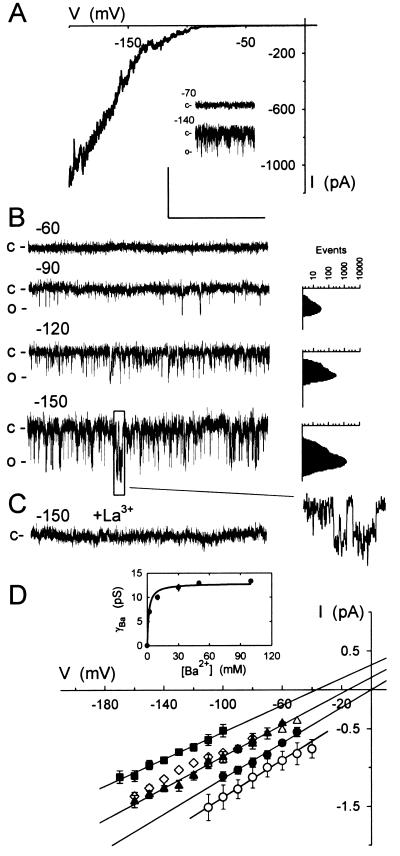
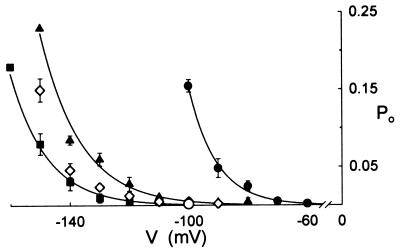
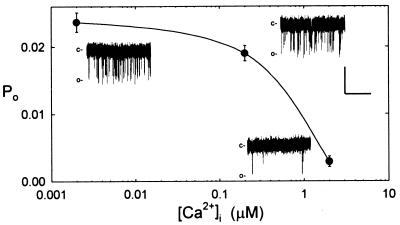
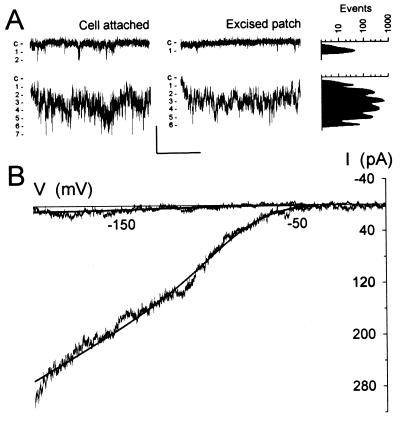
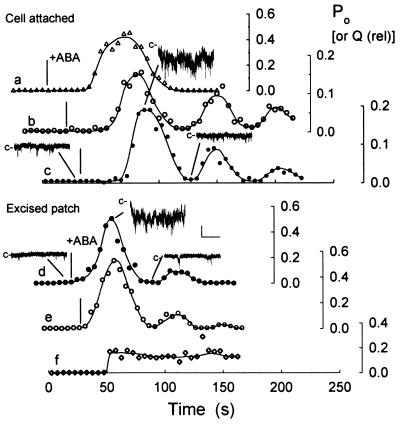
In stomatal guard cells of higher-plant leaves, abscisic acid (ABA) evokes increases in cytosolic free Ca(2+) concentration ([Ca(2+)](i)) by means of Ca(2+) entry from outside and release from intracellular stores. The mechanism(s) for Ca(2+) flux across the plasma membrane is poorly understood. Because [Ca(2+)](i) increases are voltage-sensitive, we suspected a Ca(2+) channel at the guard cell plasma membrane that activates on hyperpolarization and is regulated by ABA. We recorded single-channel currents across the Vicia guard cell plasma membrane using Ba(2+) as a charge-carrying ion. Both cell-attached and excised-patch measurements uncovered single-channel events with a maximum conductance of 12.8 +/- 0.4 pS and a high selectivity for Ba(2+) (and Ca(2+)) over K(+) and Cl(-). Unlike other Ca(2+) channels characterized to date, these channels rectified strongly toward negative voltages with an open probability (P(o)) that increased with [Ba(2+)] outside and decreased roughly 10-fold when [Ca(2+)](i) was raised from 200 nM to 2 microM. Adding 20 microM ABA increased P(o), initially by 63- to 260-fold; in both cell-attached and excised patches, it shifted the voltage sensitivity for channel activation, and evoked damped oscillations in P(o) with periods near 50 s. A similar, but delayed response was observed in 0.1 microM ABA. These results identify a Ca(2+)-selective channel that can account for Ca(2+) influx and increases in [Ca(2+)](i) triggered by voltage and ABA, and they imply a close physical coupling at the plasma membrane between ABA perception and Ca(2+) channel control.
Figures
Similar articles
-
Extracellular Ba2+ and voltage interact to gate Ca2+ channels at the plasma membrane of stomatal guard cells.FEBS Lett. 2001 Feb 23;491(1-2):99-103. doi: 10.1016/s0014-5793(01)02176-7. FEBS Lett. 2001. PMID: 11226428
-
Protein phosphorylation activates the guard cell Ca2+ channel and is a prerequisite for gating by abscisic acid.Plant J. 2002 Oct;32(2):185-94. doi: 10.1046/j.1365-313x.2002.01414.x. Plant J. 2002. PMID: 12383084
-
Repetitive increases in cytosolic Ca2+ of guard cells by abscisic acid activation of nonselective Ca2+ permeable channels.Proc Natl Acad Sci U S A. 1990 Dec;87(23):9305-9. doi: 10.1073/pnas.87.23.9305. Proc Natl Acad Sci U S A. 1990. PMID: 2174559 Free PMC article.
-
Abscisic acid maintains S-type anion channel activity in ATP-depleted Vicia faba guard cells.FEBS Lett. 1998 May 29;428(3):177-82. doi: 10.1016/s0014-5793(98)00526-2. FEBS Lett. 1998. PMID: 9654130
-
Signal transduction and ion channels in guard cells.Philos Trans R Soc Lond B Biol Sci. 1998 Sep 29;353(1374):1475-88. doi: 10.1098/rstb.1998.0303. Philos Trans R Soc Lond B Biol Sci. 1998. PMID: 9800209 Free PMC article. Review.
Cited by
-
The role of reactive oxygen species in hormonal responses.Plant Physiol. 2006 Jun;141(2):323-9. doi: 10.1104/pp.106.079004. Plant Physiol. 2006. PMID: 16760482 Free PMC article. No abstract available.
-
ABA activates multiple Ca(2+) fluxes in stomatal guard cells, triggering vacuolar K(+)(Rb(+)) release.Proc Natl Acad Sci U S A. 2000 Oct 24;97(22):12361-8. doi: 10.1073/pnas.220417197. Proc Natl Acad Sci U S A. 2000. PMID: 11027317 Free PMC article.
-
Plasma membrane depolarization induced by abscisic acid in Arabidopsis suspension cells involves reduction of proton pumping in addition to anion channel activation, which are both Ca2+ dependent.Plant Physiol. 2004 May;135(1):231-43. doi: 10.1104/pp.104.039255. Plant Physiol. 2004. PMID: 15141069 Free PMC article.
-
Calcium signals: the lead currency of plant information processing.Plant Cell. 2010 Mar;22(3):541-63. doi: 10.1105/tpc.109.072686. Epub 2010 Mar 30. Plant Cell. 2010. PMID: 20354197 Free PMC article. Review.
-
Abscisic acid and CO2 signalling via calcium sensitivity priming in guard cells, new CDPK mutant phenotypes and a method for improved resolution of stomatal stimulus-response analyses.Ann Bot. 2012 Jan;109(1):5-17. doi: 10.1093/aob/mcr252. Epub 2011 Oct 12. Ann Bot. 2012. PMID: 21994053 Free PMC article. Review.
References
Publication types
MeSH terms
Substances
LinkOut - more resources
Full Text Sources
Miscellaneous
