. 2000 Apr;74(7):3082-92.
doi: 10.1128/jvi.74.7.3082-3092.2000.

Structure and coding content of CST (BART) family RNAs of Epstein-Barr virus

Affiliations

Structure and coding content of CST (BART) family RNAs of Epstein-Barr virus

P R Smith et al. J Virol. 2000 Apr.

Abstract

CST (BART BARF0) family viral RNAs are expressed in several types of Epstein-Barr virus (EBV) infection, including EBV-associated cancers. Many different spliced forms of these RNAs have been described; here we have clarified the structures of some of the more abundant splicing patterns. We report the first cDNAs representing a full-length CST mRNA from a clone library and further characterize the transcription start. The relative abundance of splicing patterns and genomic analysis of the open reading frames (ORFs) suggest that, in addition to the much studied BARF0 ORF, there may be important products made from some of the upstream ORFs in the CST RNAs. Potential biological functions are identified for two of these. The product of the RPMS1 ORF is shown to be a nuclear protein that can bind to the CBF1 component of Notch signal transduction. RPMS1 can inhibit the transcription activation induced through CBF1 by NotchIC or EBNA-2. The protein product of another CST ORF, A73, is shown to be a cytoplasmic protein which can interact with the cell RACK1 protein. Since RACK1 modulates signaling from protein kinase C and Src tyrosine kinases, the results suggest a possible role for CST products in growth control, perhaps consistent with the abundant transcription of CST RNAs in cancers such as nasopharyngeal carcinoma.


Figures
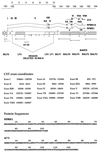
FIG. 1
FIG. 1
Map of the principal features of the EBV genome in the CST region and structures of the cDNAs discussed. The standard ORF map (9) is shown beneath a scale in kilobases, the segment deleted in B95-8 being numbered separately (30). RNA structures are shown as horizontal arrowed lines, and the three cDNA structures described in this paper are labeled A73, RPMS1A, and RPMS1. The CST exons are marked, and their coordinates are shown below. Numbers refer to the end nucleotides present in the spliced RNA at exon boundaries and relate to the B95-8 EBV sequence (1), except for exons IB, II, III, IIIA, IIIB, and IV, which are from the Raji EBV sequence (30). The protein sequences of RPMS1 and A73 are shown below in the one-letter amino acid code.
FIG. 2
FIG. 2
Exon I RPAs and primer extension. (A) Illustration of the probe used for RPA of exon I. The probe contains 383 nt of EBV sequence (from 150844 to a BglII site at 150462), of which exon I protects 125 nt (marked by arrows in B and C). RNA initiated at the start of exon I but not spliced at the 3′ end of exon I would give a protected fragment of 200 nt. (B) RPA of RNA from cell lines BM+AKATA, LCL3, and NAD and RNA from the C15 NPC xenograft, using the exon I probe. Size markers (M; lengths shown in nucleotides) are an end-labeled MspI digest of pBR322 DNA. Yeast tRNA (Y) was used as a negative control in the RPA, and the undigested probe (1% of the amount used in the RPA) is shown in track P. (C) RNA from HeLa cells transfected with plasmid SK analyzed by RPA using the exon I probe as in panel B. Other symbols are as in panel B. (D) Primer extension analysis of RNA form HeLa cells transfected with SK plasmid or pCAT Basic negative control. The primer hybridized to exon I and was extended with reverse transcriptase to give a product about 122 nt long (arrow), consistent with a 5′ end at about 150640.
FIG. 3
FIG. 3
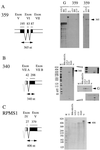
RPA of splice junctions in CST RNAs. Markers (M), yeast negative control (Y), and probes (P) were loaded as in Fig. 2. (A) RPA of RNA from LCL3 and IB4 cell lines and C15 xenograft, using probe 359 spanning splices between exons V, VI, and VII. The 359 major protected fragment from the spliced RNA is indicated (arrow). The right-hand panel contains a longer exposure of tracks Y, LCL3, and IB4. (B) RPA as in panel A, using probe 340 spanning the exon VIIA/VIIB splice containing the A73 ORF. The spliced RNA gives a 340-nt protected fragment; individual exon protection gives the 298- and 42-nt fragments. Upper and lower right-hand panels are longer exposures. The middle right-hand panel is an RPA for GAPDH cell RNA to compare loadings; NAD is weaker than the other RNA samples (arrowed G indicates GAPDH-protected fragment). (C) RPA as in panel A, using probe RPMS1 covering the exon IV/V splice. Spliced RNA gives a 406-nt protected fragment (arrow), whereas individual exon protection gives fragments of 379 and 27 nt (not shown).
FIG. 4
FIG. 4
Genomic evaluation of BALF3 and BARF0. (A) Protein sequence comparison of two parts of the BALF3 equivalents of HHV8, herpesvirus saimiri, human CMV (HCMV), and HSV with the EBV BALF3 protein (amino acid numbers in the protein sequences shown at the ends of the lines). Identities in all five proteins (∗), identities in the three gammaherpesvirus (HHV8, HVS, and EBV) proteins (!), strong similarities in all five proteins (:), and identity of two of the three gammaherpesvirus sequences (.) are indicated. (B) Comparison of the EBV and HHV8 sequences at the position of the CST poly(A) addition signal (AATAAA underlined) and the poly(A) addition signal for the BALF2 RNA on the opposite strand (TTTATT underlined). The first A of the CST AATAAA is at position 160964 in the B95-8 EBV sequence and 7057 in the equivalent HHV8 sequence (opposite strand). The point at which poly(A) is added in the sequenced clones is shown by the left end of the AAAAAA motif aligned with the EBV sequence.
FIG. 5
FIG. 5
Expression of RPMS1. (A) Cells were transfected with expression plasmids containing the Flag-tagged RPMS1 ORF, (lane 1), RPMS1 cDNA with no Flag tag (lane 2), or the RPMS1 cDNA with Flag-tagged RPMS1 (lane 3). Cell extracts were analyzed by Western blotting using an anti-Flag antibody. The position of the tagged RPMS1 protein is indicated (arrow). (B) In vitro translation of RPMS1. Proteins were derived from transcription and translation of RPMS1 cDNA (lane 1), 5′ deletion of RPMS1 cDNA commencing 11 bp prior to the start of the RPMS1 ORF (lane 2), RPMS1 ORF (lane 3), or negative control RPMS1A cDNA (lane 4). Proteins were analyzed by Western blotting using an antibody to RPMS1. The RPMS1 band is indicated (arrow). (C) The Flag-tagged RPMS1 expression construction was transfected into HeLa cells and tested for immunofluorescence using an anti-Flag antibody, demonstrating the nuclear location of the tagged RPMS1. Views i and ii are two fields of tagged RPMS1, view iii is a negative control omitting the Flag antibody, and view iv is the phase contrast image of the cells shown in view ii.
FIG. 6
FIG. 6
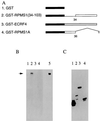
Interaction of RPMS1 and CBF1. (A) Structures of GST fusion proteins. The GST portion is filled, and the amino acid numbers of RPMS1 are noted. The ECRF4 fusion protein (line 3) was a negative control, and the RPMS1A fusion (line 4) has the same sequence as RPMS1 up to amino acid 36 but then has a different C terminus. (B) Fluorograph of gel electrophoresis of radiolabeled CBF1 protein bound to the GST fusion proteins illustrated in panel A. Track 5 contains the input CBF1 protein (10% of the amount used in the assay), and the other tracks correspond to the construction numbers in panel A. The CBF1 band is marked by an arrow. (C) Western blot of input GST fusion proteins used in pull-down assays, probed with the anti-GST antibody. Tracks correspond to the construction numbers in panel A.
FIG. 7
FIG. 7
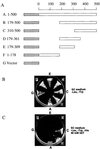
Two-hybrid interaction of CBF1 and RPMS1. (A) Structures of fusion proteins encoded by the plasmids used in a yeast two-hybrid assay. The portions of CBF1 protein (open boxes) fused to the Gal4 activation domain (hatched boxes) are shown below a scale of amino acid number of CBF1. (B) Presence of both activation domain and DNA binding domain plasmids in the yeast strains, shown by growth on −Leu, −Trp medium (letters refer to CBF1 fusion proteins in panel A). (C) Two-hybrid test of association on −Leu, −Trp, −His plates containing 40 mM 3-AT; strains are as in panel B.
FIG. 8
FIG. 8
RPMS1 inhibition of transcription induced by EBNA-2 or NotchIC on reporter plasmids pJH26A (8 × CBF1-Luciferase) or pPDL83A (4 × CpE2RE-CAT). All transfections received 1 μg of reporter plasmid and 1 μg of either EBNA-2 or Notch expression vector, as indicated. Additionally, 5 μg of plasmids expressing RPMS1, RPMS1(34-103), or RPMS1(SR) was cotransfected as shown. Results are given as a mean of three experiments, normalized on the values for EBNA-2 or NotchIC activation.
FIG. 9
FIG. 9
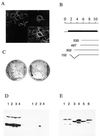
A73 is a cytoplasmic protein and interacts with RACK1. (A) Detection of Flag-tagged A73 protein in transfected cells by immunofluorescence using an anti-Flag antibody. Upper left, anti-RACK1; upper right, anti-Flag; lower left, no antibody control; lower right, merge of upper panels. Scale bar is 20 μm. (B) Diagram of RACK1 clones isolated in a two-hybrid screen. The full-length human RACK1 cDNA (33) is 1,093 nt long, and the RACK1 ORF (filled box) is from positions 96 to 1046. All clones isolated were partial cDNAs starting at 302, 530, 497 (two clones isolated), or 152 and terminating at 1093, as indicated. The clone whose 5′ end was at 152 lacked 201 to 440 from the standard sequence and may represent an alternatively spliced form of RACK1 RNA. (C) Interaction with RACK1 in two-hybrid assay. Sectors: 1, A73 and RACK1; 2, pLexA vector and pB42AD (negative control); 3, pLexA-53 and pB42AD-T (positive control, p53 and SV40 large T antigen interaction); 4, pLexA and RACK1 (negative control). The left plate demonstrates the presence of both plasmids in each yeast strain allowing growth on the selective medium; the right plate is also under His selection for two-hybrid interactions. (D) Coprecipitation of A73 with RACK1. 293 cells containing endogenous RACK1 were transfected with expression constructions for GST-RPMS1 (track 1), GST-RPMS1(34-103) (track 2), GST-A73 (track 3), and A73 (track 4). The transfected cells (tracks 1 to 3) were treated with tetradecanoyl phorbol acetate for 30 min prior to protein extraction. Extracts of the cells were Western blotted for RACK1 (left) or used in a pull-down assay with glutathione-agarose beads, isolating proteins that bound to the beads. The bound proteins were then assayed (right) by Western blotting for RACK1. (E) The cell extracts in the left part of panel D were assayed for expression of the GST fusion proteins by Western blotting using an anti-GST antibody. Cell extracts: tracks 1 and 2, GST-A73; tracks 3 and 5, GST-RPMS1(34-103); tracks 4 and 6, GST-RPMS1. Tracks 1, 5, and 6 were from cells treated with PMA; in tracks 2 to 4, the cells were not treated with PMA.

Similar articles

Cited by

References

    1. Baer R, Bankier A T, Biggin M D, Deininger P L, Farrell P J, Gibson T J, Hatfull G, Hudson G S, Satchwell S C, Seguin C, Tuffnell P, Barrell B. DNA sequence and expression of the B95-8 Epstein-Barr virus genome. Nature. 1984;310:207–211. - PubMed
    1. Breeden L, Nasmyth K. Regulation of the yeast HO gene. Cold Spring Harbor Symp Quant Biol. 1985;50:643–650. - PubMed
    1. Brooks L A, Lear A L, Young L S, Rickinson A B. Transcripts from the Epstein-Barr virus BamHI A fragment are detectable in all three forms of virus latency. J Virol. 1993;67:3182–3190. - PMC - PubMed
    1. Chang B Y, Conroy K B, Machleder E M, Cartwright C A. RACK1, a receptor for activated C kinase and a homolog of the beta subunit of G proteins, inhibits activity of src tyrosine kinases and growth of NIH 3T3 cells. Mol Cell Biol. 1998;18:3245–3256. - PMC - PubMed
    1. Chen H, Smith P, Ambinder R F, Hayward S D. Expression of Epstein-Barr virus BamHI-A rightward transcripts in latently infected B cells from peripheral blood. Blood. 1999;93:3026–3032. - PubMed

Publication types

Associated data

LinkOut - more resources