. 1999 Sep 15;13(18):2412-24.
doi: 10.1101/gad.13.18.2412.

RANK is essential for osteoclast and lymph node development

Affiliations

RANK is essential for osteoclast and lymph node development

W C Dougall et al. Genes Dev. .

Abstract

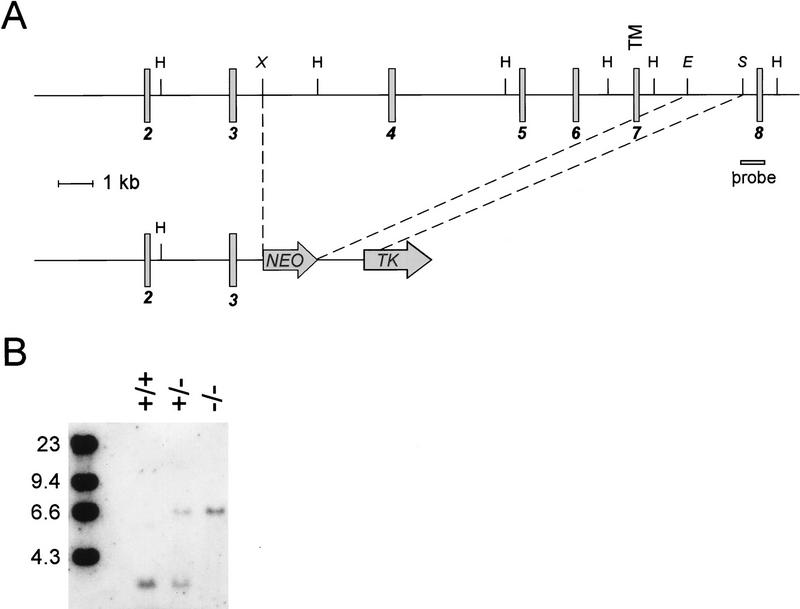
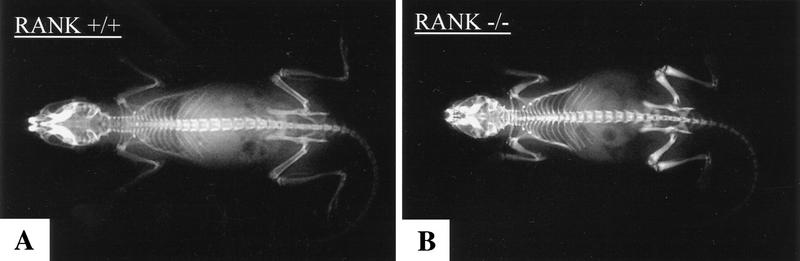
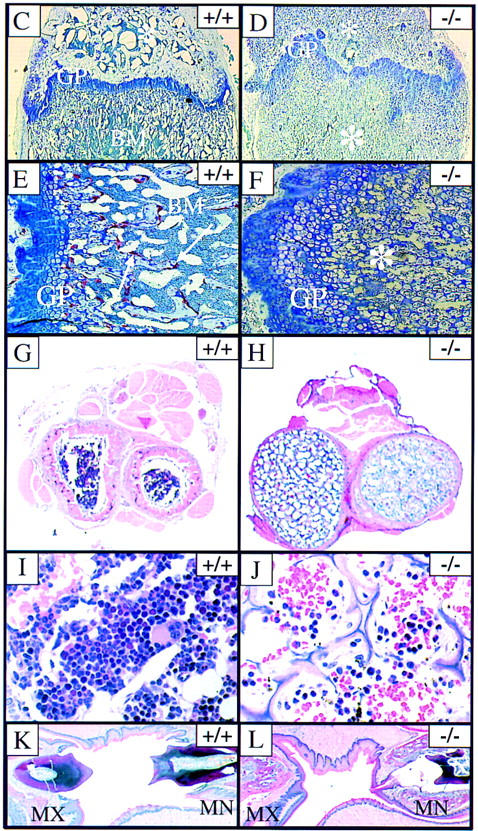
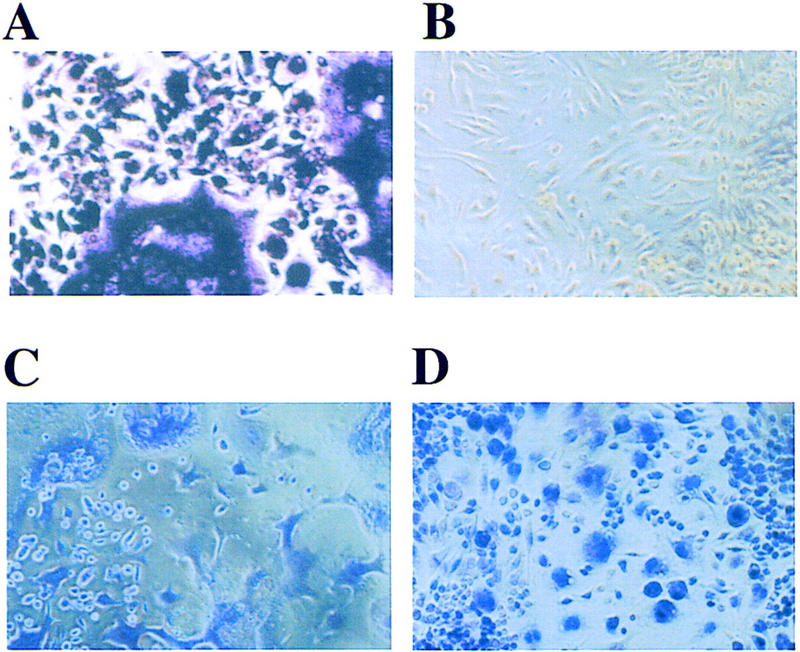
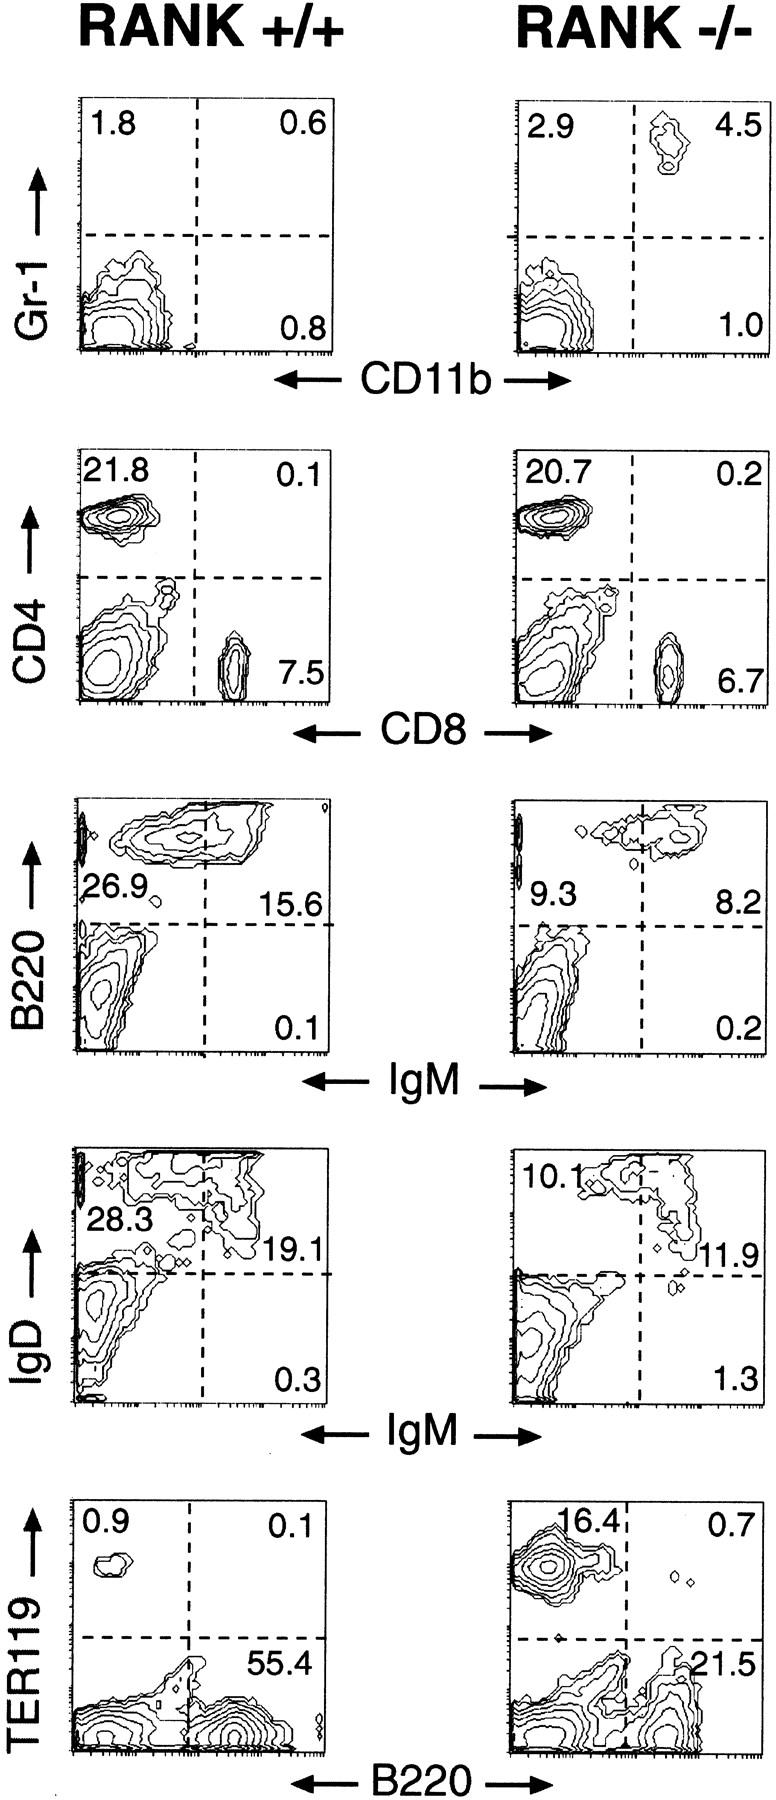
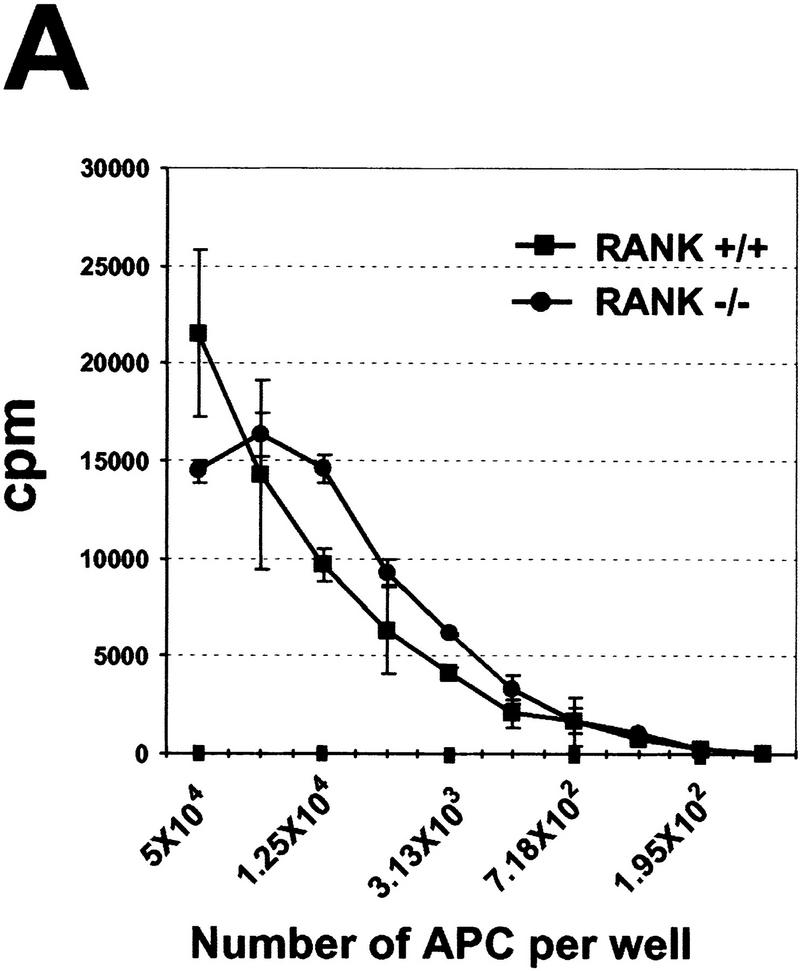
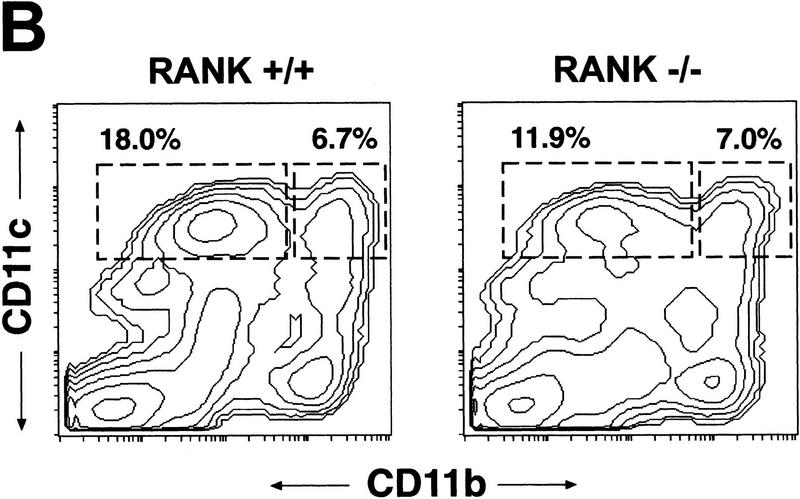
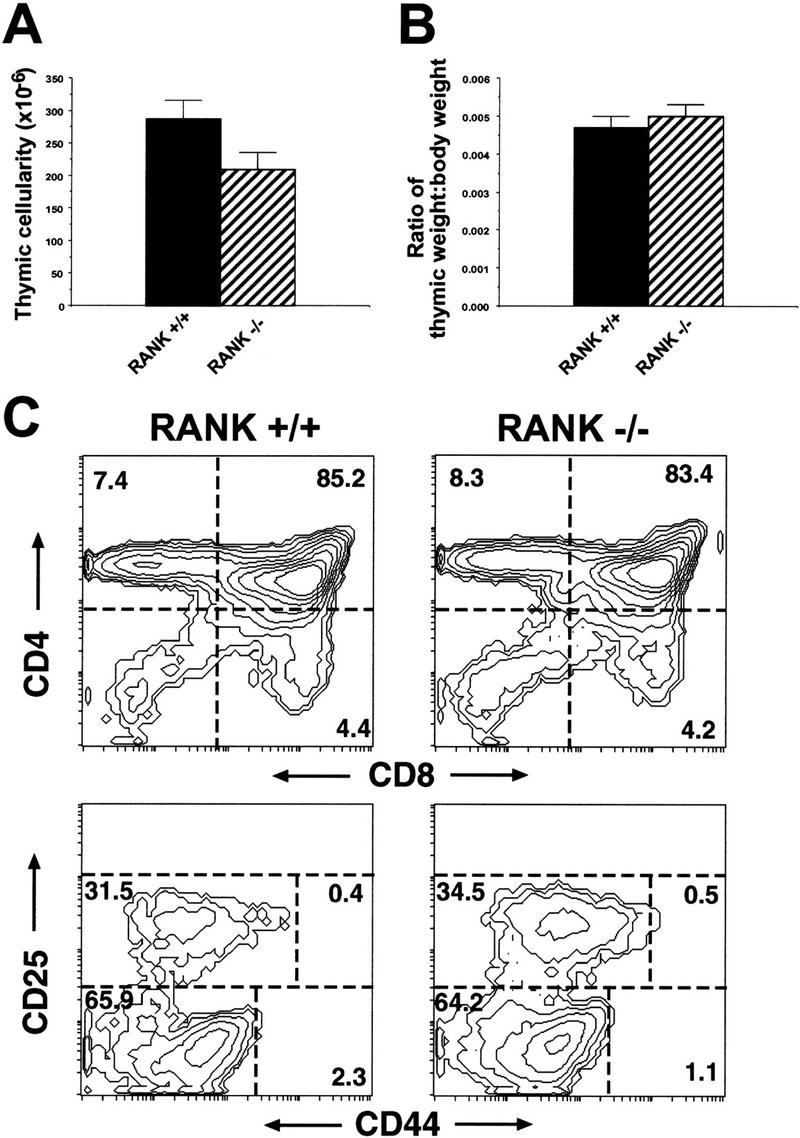
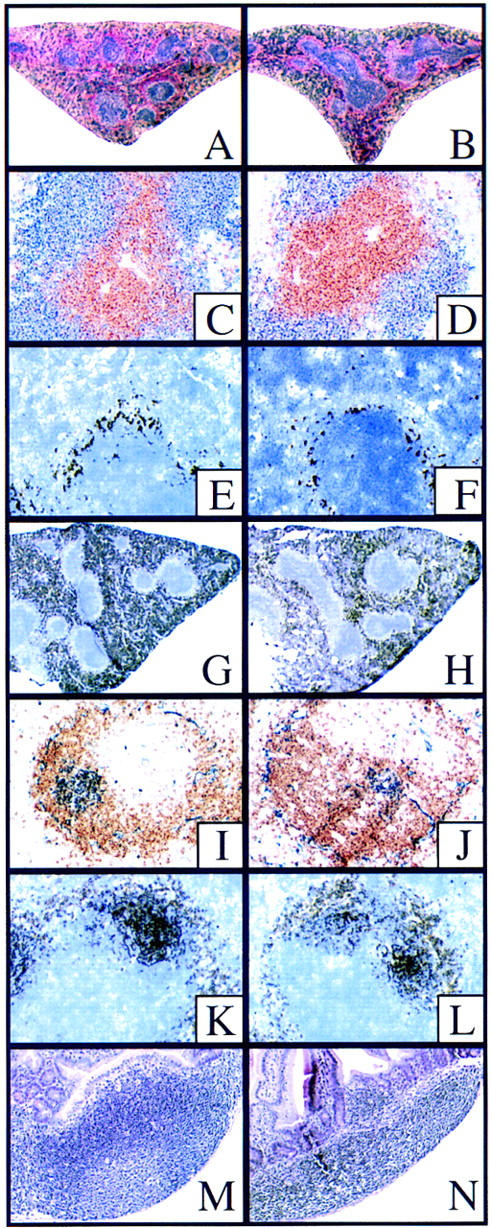
The physiological role of the TNF receptor (TNFR) family member, RANK, was investigated by generating RANK-deficient mice. RANK(-/-) mice were characterized by profound osteopetrosis resulting from an apparent block in osteoclast differentiation. RANK expression was not required for the commitment, differentiation, and functional maturation of macrophages and dendritic cells from their myeloid precursors but provided a necessary and specific signal for the differentiation of myeloid-derived osteoclasts. RANK(-/-) mice also exhibited a marked deficiency of B cells in the spleen. RANK(-/-) mice retained mucosal-associated lymphoid tissues including Peyer's patches but completely lacked all other peripheral lymph nodes, highlighting an additional major role for RANK in lymph node formation. These experiments reveal that RANK provides critical signals necessary for lymph node organogenesis and osteoclast differentiation.


Figures

Figure 1
Figure 1
Targeted disruption of RANK. (A) The structure of the RANK gene, spanning exons 2–8 (shaded boxes), and the RANK gene-targeting vector. Relevant restriction sites used to create the targeting vector and to analyze the targeted RANK gene are shown. The position of the transmembrane domain (TM) is indicated. Restriction sites: HindIII (H); XbaI (X); EcoRV (E); StuI (S). (B) Southern blot analysis of the disrupted RANK gene. Genomic DNAs from wild-type (+/+), RANK+/−, and RANK−/− cells were digested with HindIII and subjected to Southern blot analysis using the indicated probe.
Figure 2
Figure 2
Osteopetrosis in RANK−/− mice. (A,B) Radiograph of 6-week-old RANK+/+ (left) and RANK−/− (right) mice. Note the absence of the bone marrow cavity, shortening of the long bones, and overall increase in radiodensity in the RANK−/− animals. (C–L) Histological analysis of bone. (C,D) Histological staining of the femur (4× magnification). The growth plate (GP) is distorted in the RANK−/− animals and the bone marrow (BM) is filled with cartilage (*). (E,F) Histological staining of the femur (20× magnification). TRAP positive (red) osteoclasts (arrows) are readily seen in the RANK+/+ bone. Note the absence of TRAP-positive osteoclasts in RANK−/− bone and the disordering of the chondrocytes at the growth plate. (G,H) Cross section of radius and ulna indicating the occlusion of the bone marrow space in RANK−/− mice. Note the thinning of the cortical bone in RANK−/− mice. (I,J) Histological sections of vertebral bone. Note osteopetrotic condition of RANK−/− vertebrae and residual, small hematopoietic foci in the RANK−/− animal. (K,L) Histological section of the jaw, illustrating the maxilla (MX) and mandible (MN). The teeth are erupting through the wild-type jaw; in the RANK−/− mice, teeth are present but impacted in abnormal bone.
Figure 2
Figure 2
Osteopetrosis in RANK−/− mice. (A,B) Radiograph of 6-week-old RANK+/+ (left) and RANK−/− (right) mice. Note the absence of the bone marrow cavity, shortening of the long bones, and overall increase in radiodensity in the RANK−/− animals. (C–L) Histological analysis of bone. (C,D) Histological staining of the femur (4× magnification). The growth plate (GP) is distorted in the RANK−/− animals and the bone marrow (BM) is filled with cartilage (*). (E,F) Histological staining of the femur (20× magnification). TRAP positive (red) osteoclasts (arrows) are readily seen in the RANK+/+ bone. Note the absence of TRAP-positive osteoclasts in RANK−/− bone and the disordering of the chondrocytes at the growth plate. (G,H) Cross section of radius and ulna indicating the occlusion of the bone marrow space in RANK−/− mice. Note the thinning of the cortical bone in RANK−/− mice. (I,J) Histological sections of vertebral bone. Note osteopetrotic condition of RANK−/− vertebrae and residual, small hematopoietic foci in the RANK−/− animal. (K,L) Histological section of the jaw, illustrating the maxilla (MX) and mandible (MN). The teeth are erupting through the wild-type jaw; in the RANK−/− mice, teeth are present but impacted in abnormal bone.
Figure 3
Figure 3
RANK−/− hematopoietic precursors fail to form osteoclasts in vitro. Splenocytes from RANK+/+ and RANK−/− animals were cultured with 40 ng/ml mCSF-1 and 200 ng/ml mRANKL. After 7 days in culture, osteoclasts were identified by staining for TRAP, which reveals morphologically distinct osteoclasts with a purple stain in situ. TRAP+ osteoclasts are only seen from RANK+/+ cultures (A) and not in cultures from RANK−/− mice (B). Staining with hematoxylin (C,D) reveals cells in both cultures, including cells with monocytic/macrophage morphology in the RANK−/− cultures (D).
Figure 4
Figure 4
Defective B-lymphocyte development in RANK−/− mice. Flow cytometric analysis of spleen cells from 6–8-week-old RANK+/+ (left) and RANK−/− (right) mice. Details of the cytometric analyses are described in Materials and Methods. The histograms are representative of multiple RANK+/+ (n = 6) and RANK−/− (n = 7) mice. The numbers represent the percentage positive cells within each gated quadrant.
Figure 5
Figure 5
Elevated extramedullary hematopoiesis in RANK−/− mice. Cells were cultured in methylcellulose in the presence of rmuIL-3 plus rmuMGF (c-kit ligand) plus rmu EPO (CFU-E, CFU-GM, and CFU-GEMM) or with rmu CSF-1 (CFU-M), as described in Materials and Methods. Absolute numbers of clonogenic precursors observed with RANK+/− cells were similar to wild-type levels (data not shown). (Hatched bars) RANK+/+ mice; (solid bars) RANK−/− mice. Values represent the means ± s.e.m. for four experiments done in triplicate.
Figure 6
Figure 6
RANK−/− mice show normal DC development and function. (A) The allostimulatory capacity of CD11c+ DCs from untreated RANK+/+ (█) and RANK−/− (●) mice was measured in a mixed lymphocyte reaction (MLR) as described in Materials and Methods. Values represent the mean ± s.e.m. of triplicate cultures and are representative of experiments from multiple mice (n = 3). (B) Flow cytometric analysis of splenic DCs from FL-treated RANK+/+ (left) and RANK−/− (right) animals. Mice were treated with FL for nine days (see Materials and Methods) to mobilize DC, and single cell spleen suspensions were stained for CD11b and CD11c. The percentages of the lymphoid-related DC (CD11blow CD11c+) and myeloid-related DC (CD11b+ CD11c+) are indicated above the gated areas.
Figure 6
Figure 6
RANK−/− mice show normal DC development and function. (A) The allostimulatory capacity of CD11c+ DCs from untreated RANK+/+ (█) and RANK−/− (●) mice was measured in a mixed lymphocyte reaction (MLR) as described in Materials and Methods. Values represent the mean ± s.e.m. of triplicate cultures and are representative of experiments from multiple mice (n = 3). (B) Flow cytometric analysis of splenic DCs from FL-treated RANK+/+ (left) and RANK−/− (right) animals. Mice were treated with FL for nine days (see Materials and Methods) to mobilize DC, and single cell spleen suspensions were stained for CD11b and CD11c. The percentages of the lymphoid-related DC (CD11blow CD11c+) and myeloid-related DC (CD11b+ CD11c+) are indicated above the gated areas.
Figure 7
Figure 7
Intact thymocyte development in RANK−/− mice. (A) Cell counts of thymi from 6- to 8-week-old RANK+/+ (n = 14) and RANK−/− (n = 14) mice. (B) The thymic weights were expressed as a proportion of total body weight. Note the equivalent thymic weight/body weight ratios observed in RANK+/+ and RANK−/− mice. (C) Flow cytometric analysis of thymi from 6-week-old RANK+/+ or RANK−/− mice. Thymocyte suspensions were stained for CD4 and CD8 (top) or gated, Lin (CD3ε, CD4, CD8, B220, GR-1, CD11b, TCRγδ) thymocyte precursors were stained for CD25 and CD44 (bottom).
Figure 8
Figure 8
Histological staining of spleen and Peyer’s patches. Wild-type (A) and RANK−/− (B) spleens stained with hematoxylin and Eosin; both spleens show normal lymphocytic follicles. (C,D) Immunostaining for B- and T-cell organization. Anti-CD3 (brown) and anti-B220 (blue) reveals normal B/T-cell segregation in spleens of both wild-type (C) and RANK−/− (D) mice. (E,F) MOMA-1 staining (black) to indicate splenic white pulp marginal zone macrophages. The RANK−/− spleen shows slightly reduced staining for MOMA-1 positive cells (F). (G,H) Immunohistology of macrophage populations in the spleen using anti-BM8 (black) indicating slightly reduced staining for BM-8-positive macrophages in RANK−/− spleen (H) relative to control (G). Immunohistology of germinal centers (I–L). Anti-B220 (brown) and PNA (blue) indicate PNA-positive regions centered within B-cell areas in both wild-type (I) and RANK−/− (J) spleens. The size and density of the germinal center-like PNA+ regions was slightly reduced in RANK−/− spleens. (K,L) Anti-CD35 staining (black) indicates intact follicular dendritic cell networks around PNA+ germinal centers in both wild-type (K) and RANK−/− (L) spleens. Histology of Peyer’s patches (M,N). H&E stain of Peyer’s patches of wild-type (M) and RANK−/− (N) mice. Note reduced size and cellularity of RANK−/− Peyer’s patches.

Similar articles

Cited by

References

    1. Anderson DM, Maraskovsky E, Billingsley WL, Dougall WC, Tometsko ME, Roux ER, Teepe MC, DuBose RF, Cosman D, Galibert L. A homologue of the TNF receptor and its ligand enhance T-cell growth and dendritic-cell function. Nature. 1997;390:175–179. - PubMed
    1. Bachmann MF, Wong BR, Josien R, Steinman RM, Oxenius A, Choi Y. TRANCE, a tumor necrosis factor family member critical for CD40 ligand-independent T helper cell activation. J Exp Med. 1999;189:1025–1031. - PMC - PubMed
    1. Begg SK, Radley JM, Pollard JW, Chisholm OT, Stanley ER, Bertoncello I. Delayed hematopoietic development in osteopetrotic (op/op) mice. J Exp Med. 1993;177:237–242. - PMC - PubMed
    1. Brasel K, McKenna HJ, Morrissey PJ, Charrier K, Morris AE, Lee CC, Williams DE, Lyman SD. Hematologic effects of flt3 ligand in vivo in mice. Blood. 1996;88:2004–2012. - PubMed
    1. Bucay N, Sarosi I, Dunstan CR, Moroney S, Tarpley J, Capparelli C, Scully S, Tan HL, Xu W, Lacey DL, Boyle WJ, Simonet WS. Osteoprotegerin-deficient mice develop early onset osteoporosis and arterial calcification. Genes & Dev. 1998;12:1260–1268. - PMC - PubMed

MeSH terms

Substances