Summary
While stem cell-derived islets hold promise as a therapy for insulin-dependent diabetes, challenges remain in achieving this goal1–6. Here we generate human islet-like organoids (HILOs) from induced pluripotent stem cells (iPSCs) and show that non-canonical WNT4 signaling drives the metabolic maturation necessary for robust ex vivo glucose-stimulated insulin secretion. These functionally mature HILOs contain endocrine-like cell types that, upon transplantation, rapidly re-establish glucose homeostasis in diabetic NOD-SCID mice. Overexpression of the immune checkpoint protein PD-L1 protected HILO xenografts such that they were able to restore glucose homeostasis in immune-competent diabetic mice for 50 days. Furthermore, ex vivo interferon gamma stimulation induced endogenous PD-L1 expression and restricted T cell activation and graft rejection. The generation of glucose-responsive islet-like organoids able to avoid immune detection provides a promising alternative to cadaveric and device-dependent therapies in the treatment of diabetes.
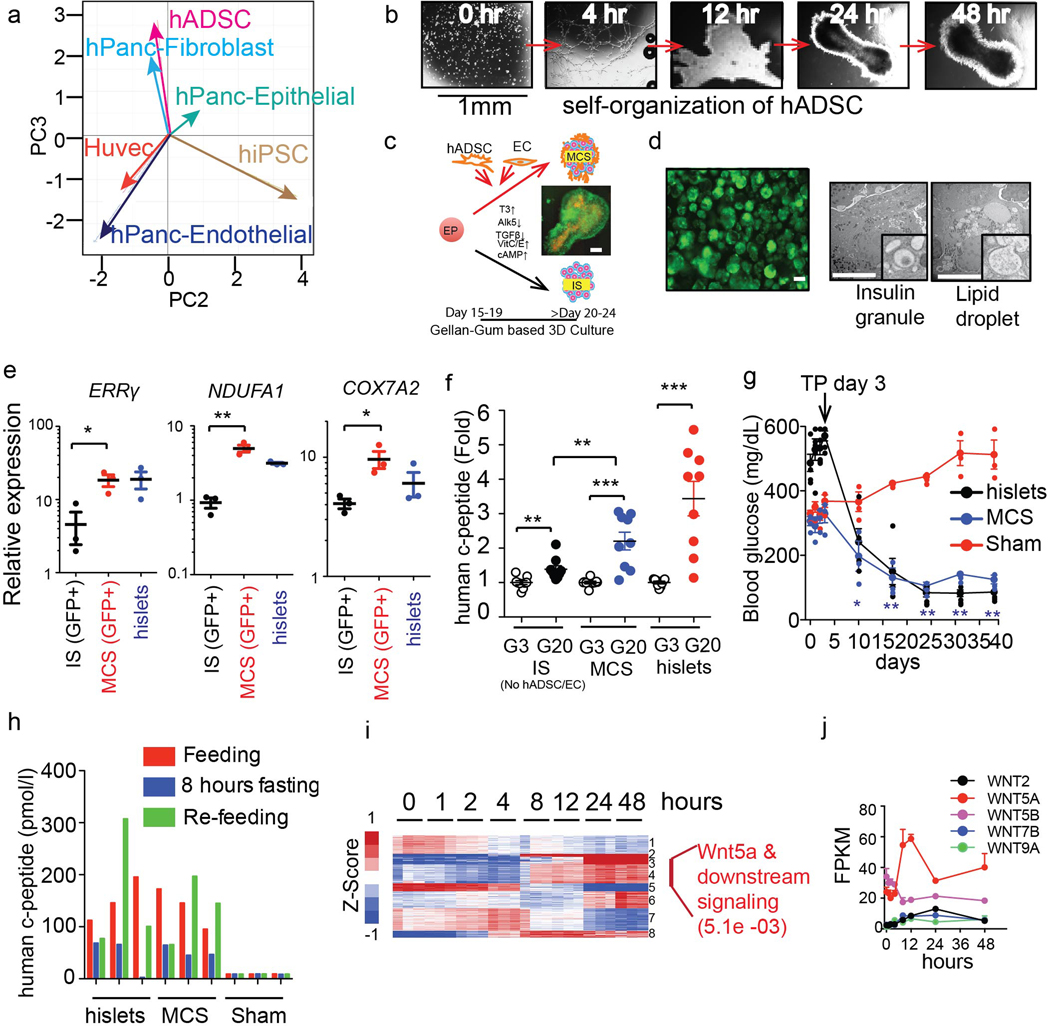
Islet transplantation provides superior long-term blood glucose control for type 1 and late-stage type 2 diabetics, however the availability and quality of cadaveric islets limits its success and utility. While the differentiation of induced pluripotent stem cells (iPSCs) into insulin-producing β-like cells represents a major advance, the science needed for generating functional β-like cells appropriate for human therapy remains incomplete1–6. Towards this end, we demonstrated that the nuclear hormone receptor ERRγ drives a postnatal metabolic maturation program necessary for β-cell glucose-stimulated insulin secretion (GSIS)1. Furthermore, ERRγ overexpression in iPSC-derived β-like cells is sufficient for in vitro and in vivo functionality1. With the goal of generating functional cells suitable for transplantation, we explored culture conditions designed to replicate the cellular architecture, as well as the cell type diversity of islets. We initially exploited the cell-intrinsic abilities of human adipose-derived stem cells (hADSCs) and human umbilical vein endothelial cells (HUVECs), which mimic pancreatic fibroblast and pancreatic endothelial cells, respectively, to form organ-like and vascular structures when grown in three-dimensional (3D) cultures (Extended Data Fig. 1a–c and data not shown), and a polysaccharide-based suspension gel (gellan gum). Incorporating hADSCs and HUVECs during the differentiation of hiPSC-derived endocrine progenitors (EPs) in a 3D gellan gum gel led to the formation of multicellular spheroids (MCSs) comparable in size to human islets (Extended Data Fig. 1d). Encouragingly, MCSs contained insulin-producing cells (based on insulin promoter-driven GFP expression and the presence of insulin granules) and incorporated hADSCs as determined by the presence of lipid droplet-containing cells (Extended Data Fig. 1d). Furthermore, the increased expression of ERRγ and mitochondrial genes NDUFA1 and COX7A2 in MCSs compared to differentiation in the absence of hADSCs and HUVECS (IS), correlated with improved in vitro insulin secretion in response to a glucose challenge (Extended Data Fig. 1e, f). MCSs transplanted into the kidney capsule were able to maintain glucose homeostasis for ~40 days in STZ-induced diabetic NOD-SCID mice, displaying similar efficacy to human islet transplantations (Extended Data Fig. 1g). Moreover, transplanted MCSs remained glucose responsive, appropriately regulating insulin secretion in the fed, fasted, and refed states as indicated by human c-peptide levels (Extended Data Fig. 1h; mouse insulin levels were <0.2 ng/ml, data not shown). These results support the role of 3D multicellular interactions in organogenesis7,8.
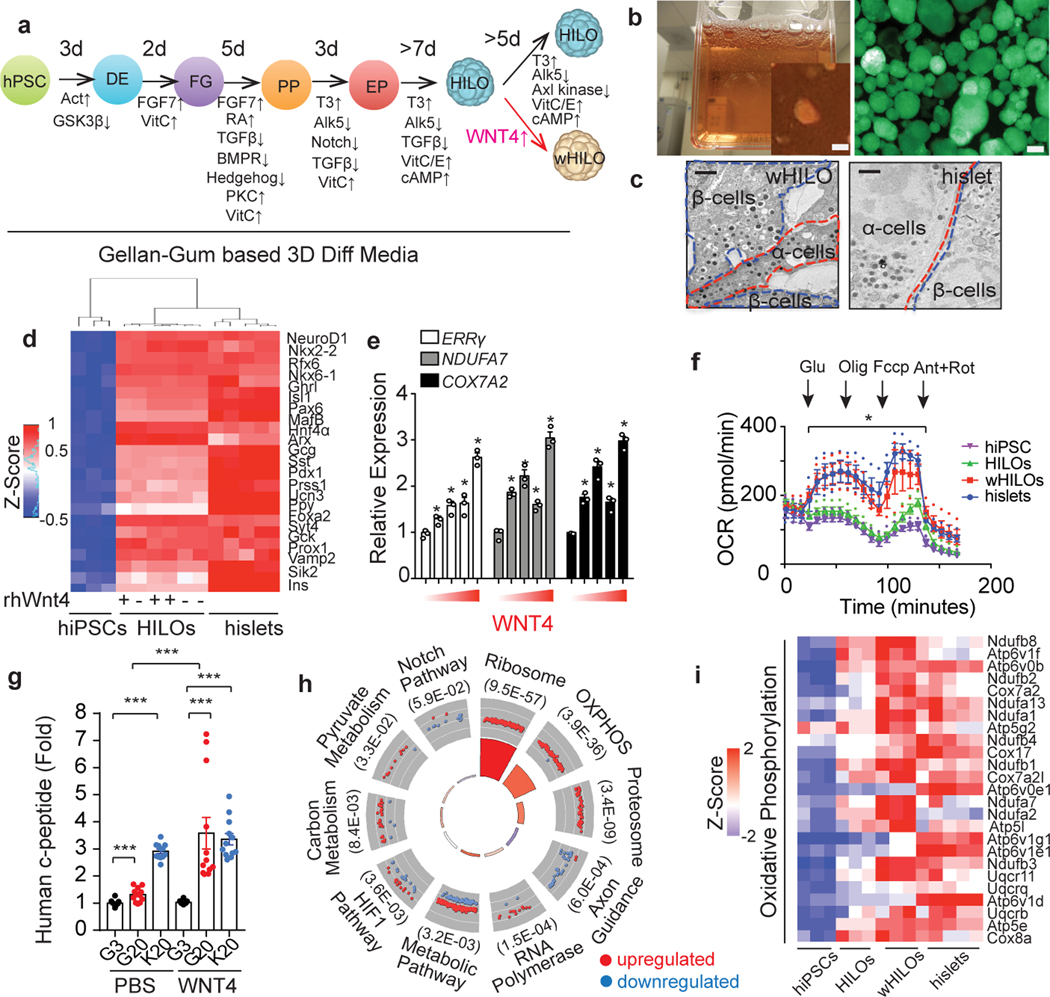
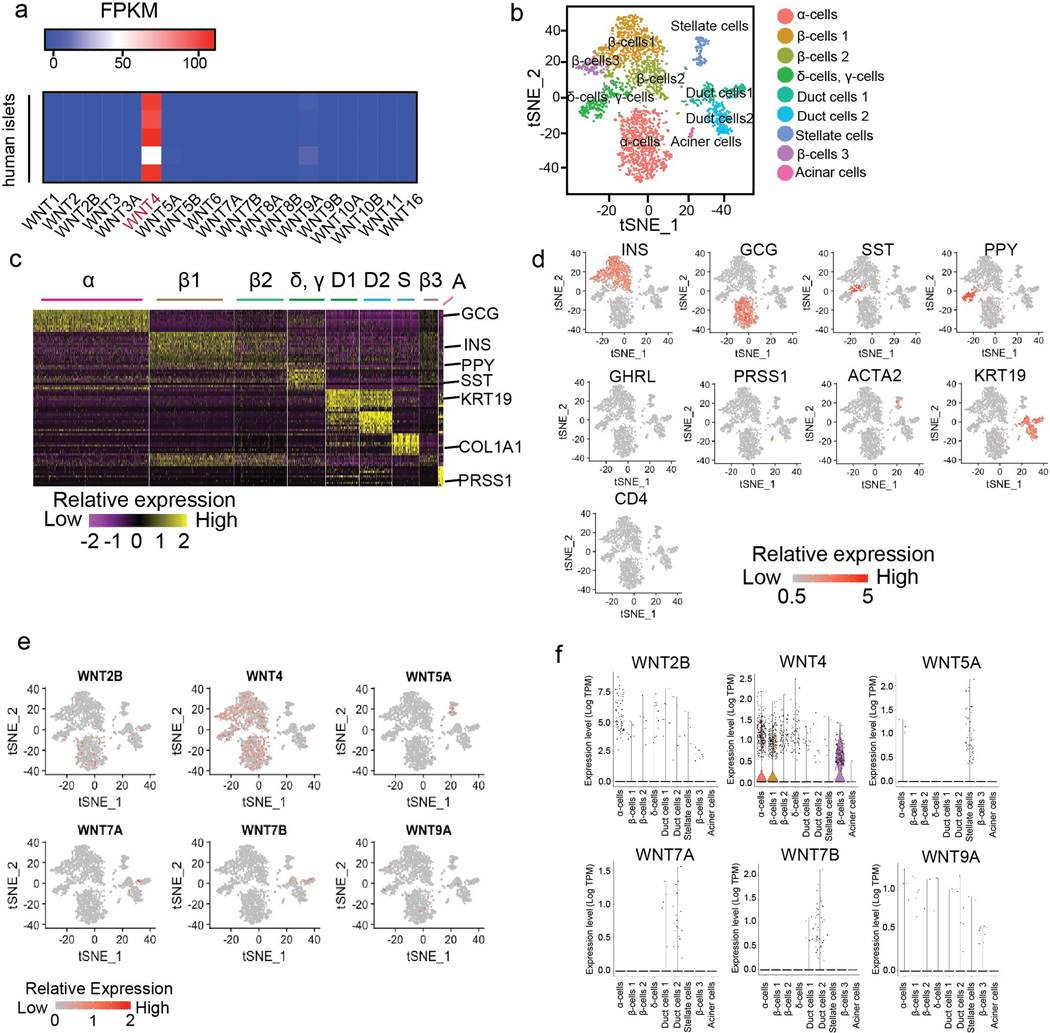
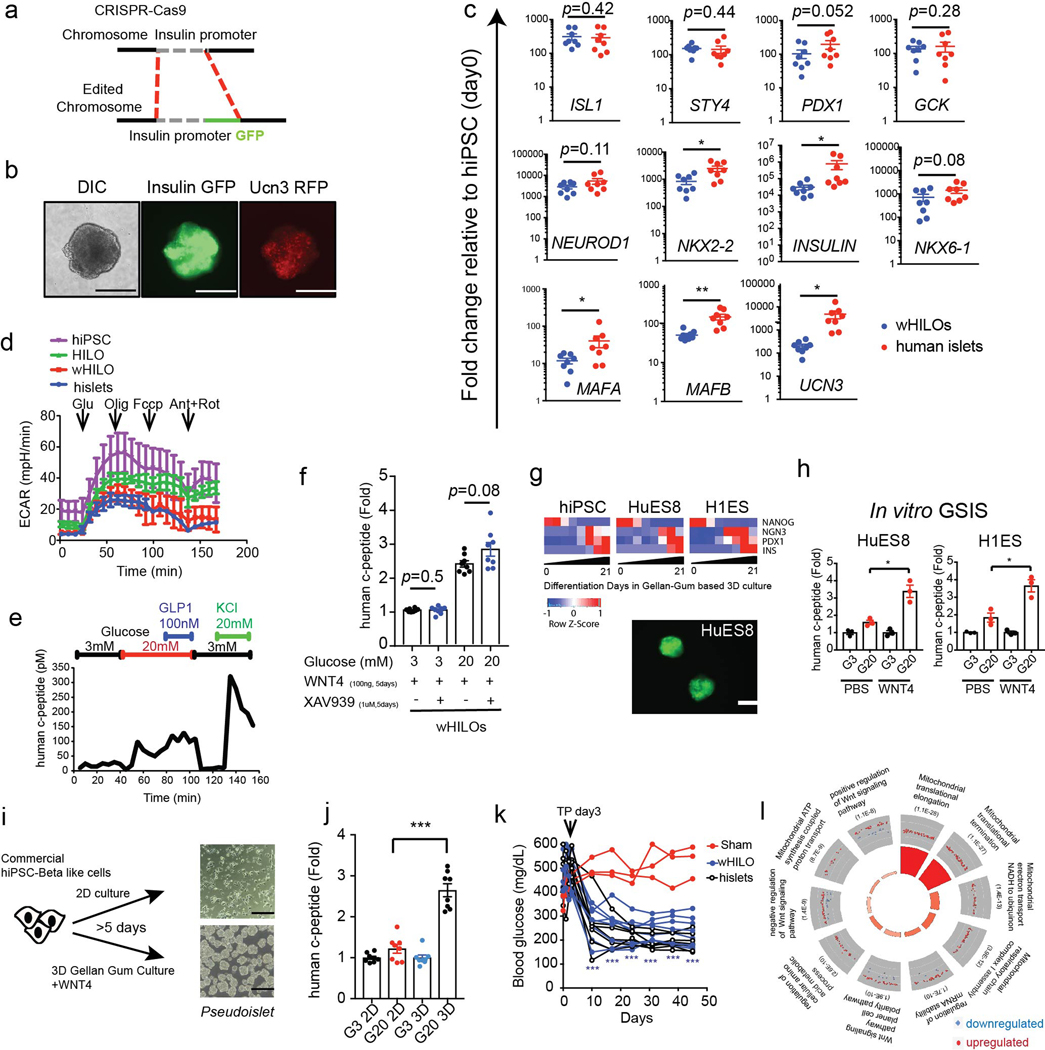
Gene ontology of the transcriptional changes induced during hADSC self-assembly identified enrichment of metabolic and cytokine signaling pathways, as well as WNT signaling (Extended Data Fig. 1i, Supplementary Table 1). Consistent with this, the temporal expression of WNTs during hADSC self-assembly revealed a transient, ~2 fold increase in WNT5a expression that coincided with the initial cell-cell interactions observed in 3D cultures (Extended Data Fig. 1j). WNT4 expression is enhanced during the postnatal functional maturation of mouse islets, and the non-canonical WNT pathway has been shown to induce β-cell maturation and increase GSIS in human islets1,9. In agreement with these findings, we find WNT4 to be highly expressed in human islets (Extended Data Fig. 2a). Moreover, single-cell sequencing of human islets identified widespread expression of WNT4 in β- and α-cells, along with more restricted WNT5A expression predominantly in stellate cells (Extended Data Fig. 2b–f). Based on these findings, we proposed that WNT signaling was sufficient for ex vivo functional maturation of iPSC-derived β-like cells. To explore this notion, we used CRISPR-Cas9 genome editing to insert the GFP-coding sequence downstream of the insulin promoter in hiPSCs (Extended Data Fig. 3a), to generate a reporter for endogenous insulin promoter activity. Differentiation of these engineered hiPSCs in a fully chemically-defined 3D-culture system that incorporated WNT4 in a final maturation step led to the formation of human islet-like organoids (HILOs) that express insulin (Fig. 1a, b). In addition, high expression of Urocortin-3 (UCN3, secreted from β-cells to regulate δ-cell somatostatin secretion 10,11,12) and insulin was seen in HILOs as visualized with a double reporter line (Insulin promoter-driven GFP and UCN3 promoter-driven RFP, Extended Data Fig. 3b). Moreover, analysis of HILOs by electron microscopy revealed structural similarities to human islets, most notably the presence of insulin and glucagon granules (Fig. 1c).
Fig. 1. WNT4 induces functional maturation of human islet-like organoids (HILOs).
a, Schematic of human islet-like organoid (HILO) generation. b, Representative images of HILOs in 3D culture (left panel), and insulin expression (human insulin promoter driven GFP, right panel, scale bar 100 μm). c, Electron microscopy images showing insulin and glucagon granules in β and α cells, respectively, in WNT4-treated HILOs (wHILOs) and human islets. Scale bar, 1 μm. d, Heatmap of relative expressions of key islet genes in hiPSCs (n=3), HILOs treated with PBS (−)(n=3) or WNT4 (+) (n=3), and human islets (n=5) (log2 expression with Z-score). e, Relative expression of ERRγ, NDUFA7 and COX7A2 in HILOs after treatment with increasing concentrations of WNT4 (0, 10, 25, 50, 200ng/ml for 5 days) (n=3). f, Oxygen consumption rate (OCR) measured in hiPSC spheroids (day 0, purple), PBS-treated HILOs (green), WNT4-treated HILOs (red) and human islets (blue) (n=3) g, in vitro human c-peptide secretion in response to 3mM (G3) or 20 mM (G20) glucose or 20mM KCl (K20) from HILOs generated with and without WNT4 treatment (n=12) h, Gene ontology of WNT4-regulated genes in HILOs (100ng/ml WNT4 from day 26 to day 33). i, Heatmap of relative expressions of oxidative phosphorylation genes in 3D cultured hiPSCs (n=3), HILOs (n=3), HILOs after WNT4 treatment (wHILOs) (n=3), and human islets (n=5)(Z-Score). Error bars represent ± SEM.*p<0.05, ***p<0.001, one-tailed, student’s paired t test. Data representative of 3 independent experiments (c, e, f, g).
Comparative transcriptional analyses confirmed similar expression of multiple key islet cell markers in WNT4-treated HILOs (wHILOs) and human islets, including β- (NKX6–1, NEUROD1, RFX6, GCK, ISL1, STY4, PDX1) and α- (ARX) cell-specific genes, while INS, MAFA, MAFB, UCN3, NKX2–2 exhibited lower expression (Fig. 1d, Extended Data Fig. 3c). Importantly, the expression of β-cell lineage specification markers including INS, NKX6–1, UCN3, MAFB and SYT4 was not altered by the addition of WNT4, indicating that WNT signaling was not affecting cell fate determination. In contrast, WNT4 dose dependently increased the expression of ERRγ (encoded by ESRRG) as well as components of the mitochondrial respiratory chain NDUFA7 and COX7A2 in HILOs (Fig. 1e). Consistent with these inductions, HILOs generated in the presence of WNT4 displayed increased oxidative metabolism, as measured by an increase in oxygen consumption rate (OCR) and decreased extracellular acidification rate (ECAR), replicating the metabolic characteristics of healthy human islets13 (Fig. 1f, Extended Data Fig. 3d). WNT4-treated HILOs showed improved in vitro GSIS; an effect that was not blocked by the β-catenin inhibitor XAV939 implicating non-canonical WNT signaling as the driver of WNT4-induced β-cell maturation14 (Fig. 1g, Extended Data Fig. 3e, f). Comparable transcriptional and functional changes were observed during the differentiation and maturation of the pluripotent HuES8 and H1ES cells, demonstrating the robustness of our protocol (Extended Data Fig. 3g, h). Furthermore, culturing commercially available glucose non-responsive hiPSC-derived β-like cells in 3D differentiation media containing WNT4 promoted pseudoislet formation and GSIS functionality (Extended Data Fig. 3i, j). Importantly, transplanted wHILOs restored glycemic control in STZ-induced NOD-SCID diabetic mice and maintained glucose homeostasis for >6 weeks (Extended Data Fig. 3k). In combination, these results indicate that non-canonical WNT signaling is sufficient to induce a metabolic maturation of HILOs needed for robust GSIS.
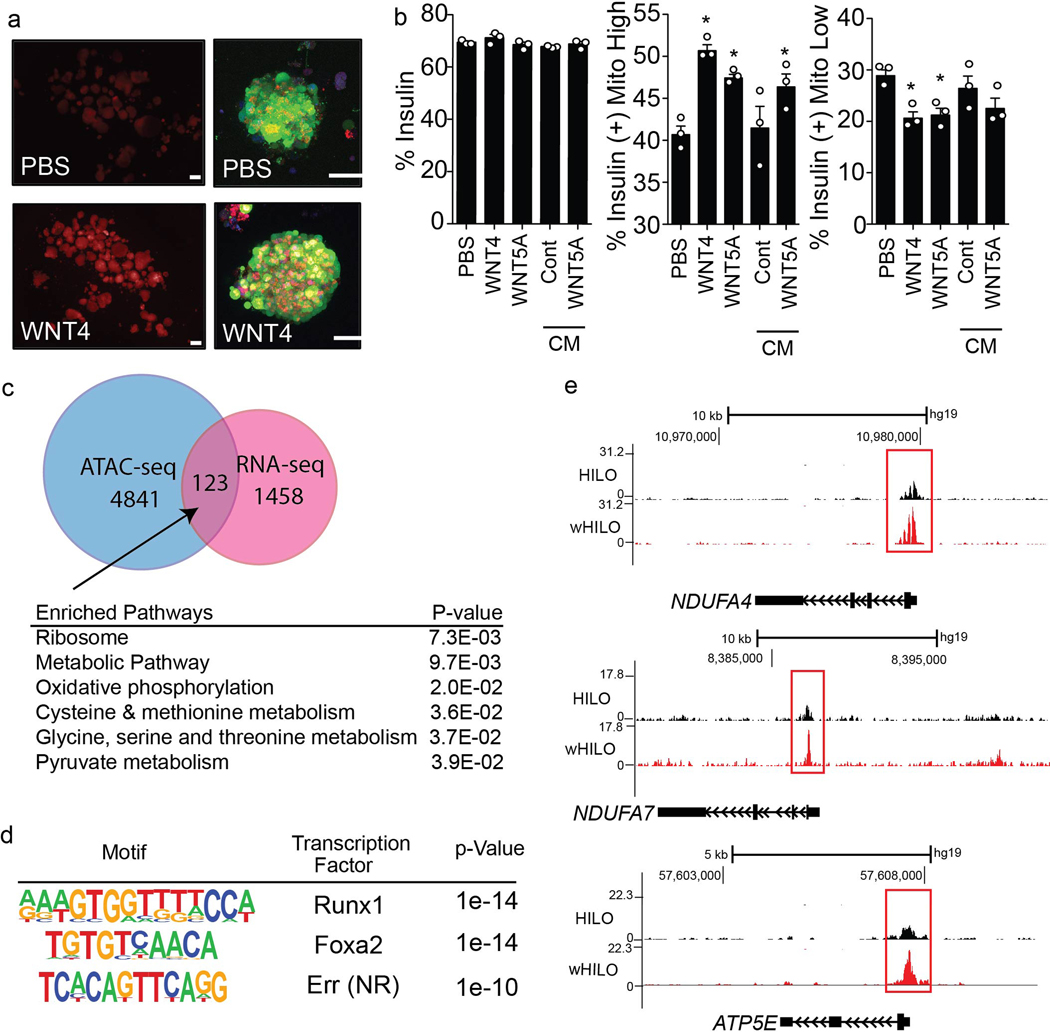
To understand the molecular transformations driving the maturation of HILOs, we determined the transcriptional changes induced by WNT4 treatment. The expression of 1581 and 1354 genes were increased and decreased, respectively, by WNT4 treatment (100 ng/ml for days 26–33). Gene ontology identified metabolic pathways, most notably oxidative phosphorylation, enriched in the up-regulated gene set (Fig. 1h, genes associated with the ribosome include mitochondrial translation and elongation gene clusters as determined by DAVID GOTERM_BP analysis, Extended Data Fig. 3l). Consistent with an effect on cellular metabolism, WNT4 treatment comprehensively increased the expression of OxPhos genes in HILOs to levels similar to those seen in human islets, and increased mitochondrial number (Fig. 1i, Extended Data Fig. 4a). To examine the specific effects on the β-like cell population, insulin-expressing cells were sorted based on GFP expression from HILOs with and without WNT4 or WNT5a treatment. The proportion of insulin-expressing cells was not affected by WNT treatment, in agreement with the invariant β-cell lineage marker expression during HILO maturation (Extended Data Fig. 4b). However, WNT4 and WNT5a treatment increased the mitochondrial content of the insulin-expressing cells, supporting the notion that this underpins the metabolic maturation of β-like cells (Extended Data Fig. 4b). To identify genetic effectors of this maturation step, WNT4-induced changes in chromatin accessibility were mapped in sorted GFP+ cells by ATAC-Seq. Widespread minor alterations in chromatin accessibility were seen with WNT4 treatment. Gene ontology of the 123 genes with increases in expression and chromatin accessibility upon WNT4 treatment identified metabolic pathways, including oxidative phosphorylation, while motif analysis of this gene subset identified β-cell maturation factors including Foxa2 and ERRs (Extended Data Fig. 4c, d). Moreover, WNT4-induced increases in chromatin accessibility were seen at oxidative phosphorylation genes including ERRγ target genes NDUFA4, NDUFA7 and ATP5E (Extended Data Fig. 4e). Furthermore, WNT4 (100ng/ml for 5 days) induced the expression of mitochondrial metabolic genes and improved GSIS function in isolated neonatal islets from WT but not ERRγ β-cell specific KO mice (ERRγKO mice; Extended Data Fig. 5a, b). Taken together, these results support the notion that non-canonical WNT4 signaling enhances mitochondrial function, in large part through the induction of an ERRγ gene network that drives the metabolic maturation of β-like cells.
Cellular complexity of mature HILOs
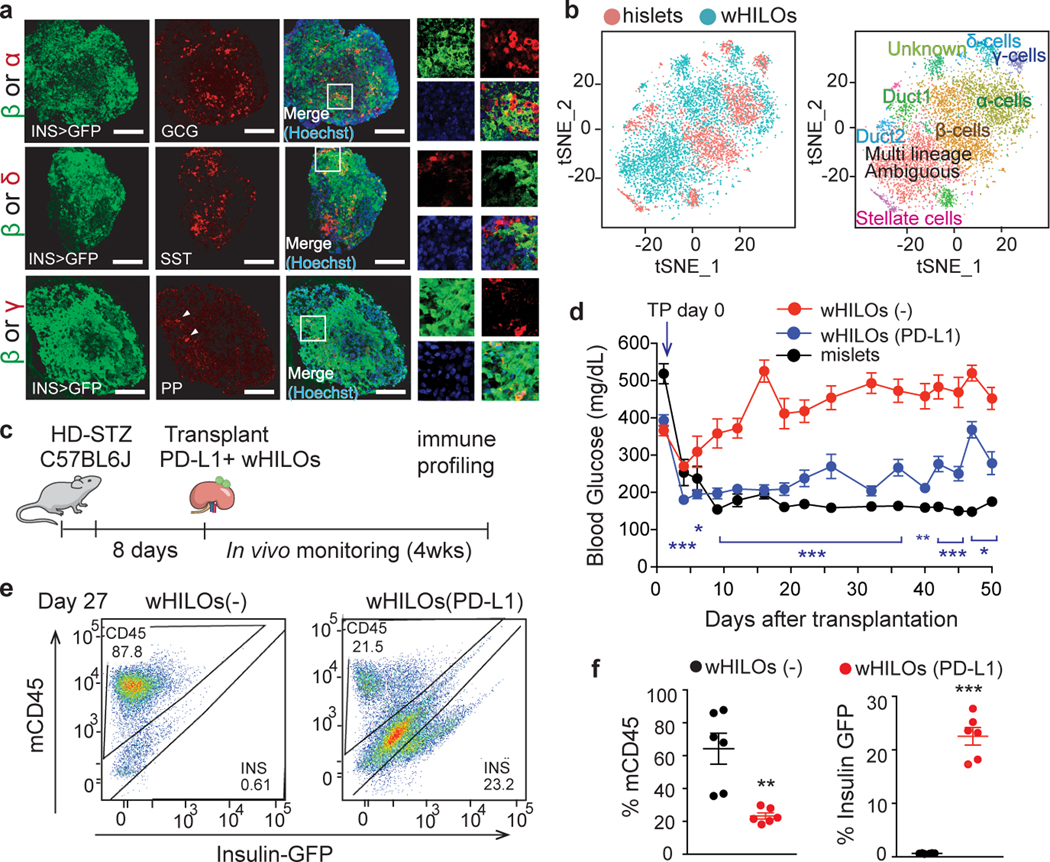
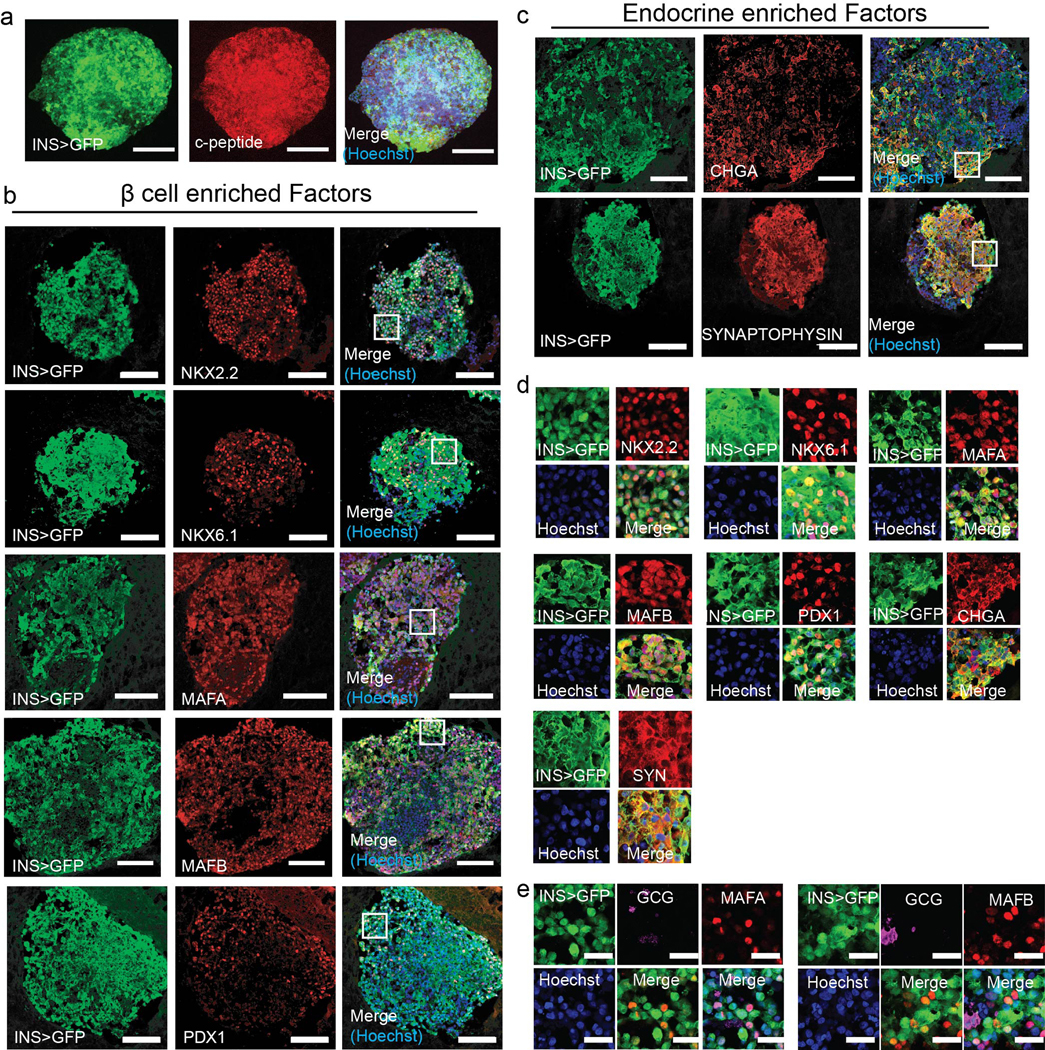
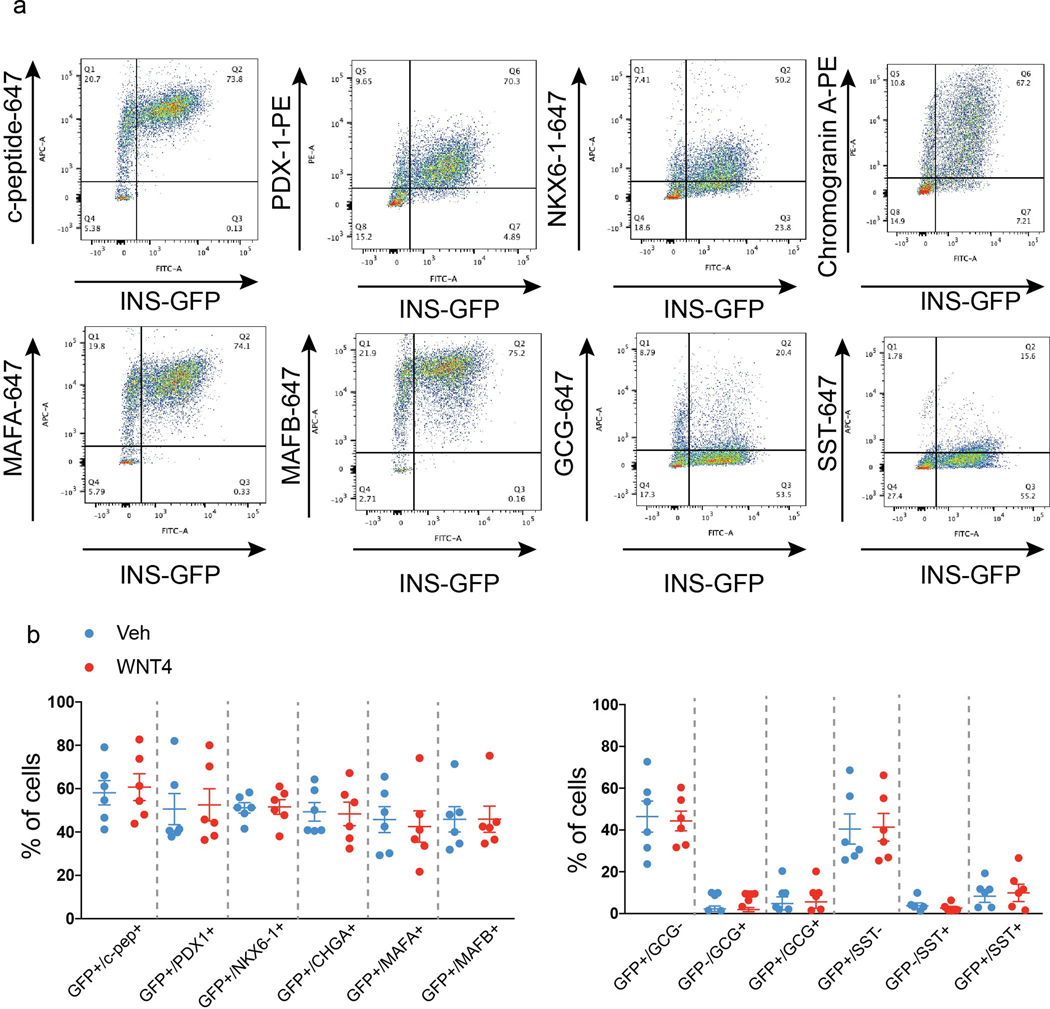
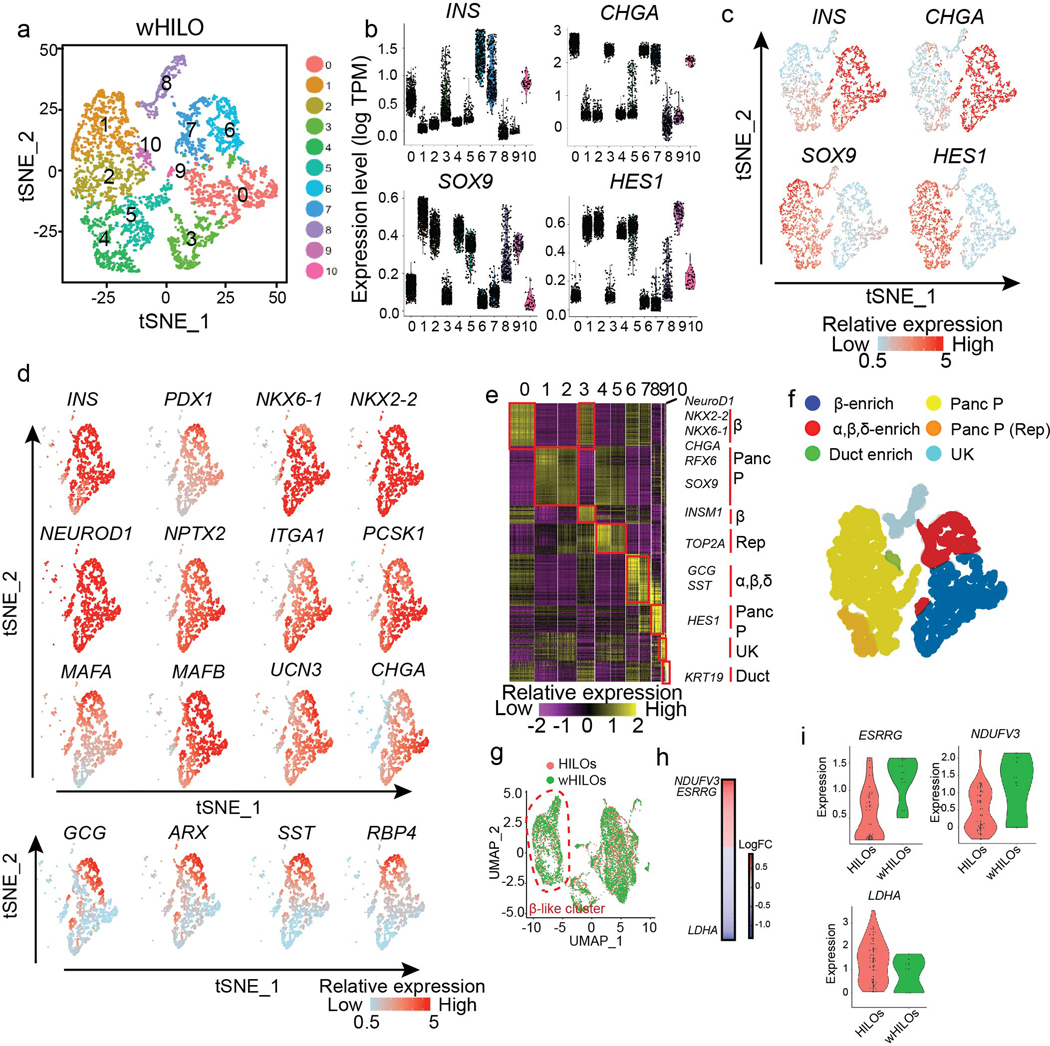
Immunohistochemical and flow cytometric analyses revealed ~50–60% of wHILO cells co-expressed insulin and β-cell markers, as well as low levels of additional endocrine cells (glucagon+, somatostatin+, pancreatic polypeptide+ (PP+)) (Fig. 2a, Extended Data Fig. 6a–e, 7a, b). In agreement with the transcriptional comparisons, the cellular composition of HILOs was not altered by WNT4 treatment (Extended Data Fig. 7b). To characterize the cellular complexity of metabolically mature HILOs and gain insight into the in vitro maturation program, we compared the single cell transcriptomes of HILOs (PBS-treated, n=4078) and wHILOs (WNT4-treated, n=4840), with those of human islets (n=3245) (Supplementary Table 2). Clustering of wHILOs revealed populations enriched in β-cell markers, as well as Sox9+HES1+ pancreatic progenitor clusters (Extended Data Fig. 8a–d). Signature gene expression analyses further distinguished non-replicating and replicating ductal-endocrine bipotent cells (+/−TOP2A), hormone-positive endocrine enriched cells (GCG+, SST+), ductal-like cells (KRT19+) and a small population of cells with unknown function (UK) (Extended Data Fig. 8e, f). Clustering of the integrated HILO and wHILO scRNA-Seq datasets revealed largely similar expression of lineage markers INS, NEUROD1, NKX6–1 and PDX-1 in the β-like cell cluster (Extended Data Fig. 8g). In contrast, expression of ERRγ and its target mitochondrial gene NDUFV3 were increased, and the glycolytic gene LDHA decreased by WNT4 treatment in INS+ERRγ+ cells (Extended Data Fig. 8h, i). A similar integrated analysis of wHILO and human islet single cell datasets confirmed the presence of multiple endocrine-like cell types (Fig. 2b). While differences were evident (Supplementary Table 3), wHILO cells clustered with islet endocrine cells including β-, α-, δ- and γ-cells, indicating transcriptional similarities (Fig. 2b). Notably, a functional classification based on co-clustering with islet cell types revealed a predominance of β- and α-like cells in wHILOs (Fig. 2b).
Fig. 2. Exogenous PD-L1 expression extends wHILO functionality in immune competent mice.
a, Representative immunofluorescence staining for glucagon, somatostatin and pancreatic polypeptide (PP) in wHILOs. b, tSNE clustering of combined wHILO (blue dots, n=4840) and human islet (red dots, n= 3245) single cell transcriptomes (left panel) and clustering analysis-defined cell types (left). c, Schematic of experimental program. High dose streptozotocin (HD-STZ, 180mg/kg) induced diabetic C57BL6J mice received transplants of wHILOs with and without PD-L1 overexpression (n=500), or mouse islets. d, Random fed blood glucose levels after transplantation of wHILOs with or without PD-L1 expression (n=11 and 9, respectively), and C57BL6J islets (n=7). e, Flow cytometric analysis of insulin-expressing and mouse immune (CD45+) cells recovered from kidney capsule grafts 27 days after transplantation of wHILOs with and without PD-L1 expression (n=6). f, Quantification of analyses in (d). Error bars represent ± SEM. *p<0.05, **p<0.01, ***p<0.001, one-tailed, student’s paired t test. Images are representative of 3 independent experiments. Data were representative (e), or compiled from 3 independent samples (b) or experiments (d, f).
PD-L1 provides immune protection for HILOs
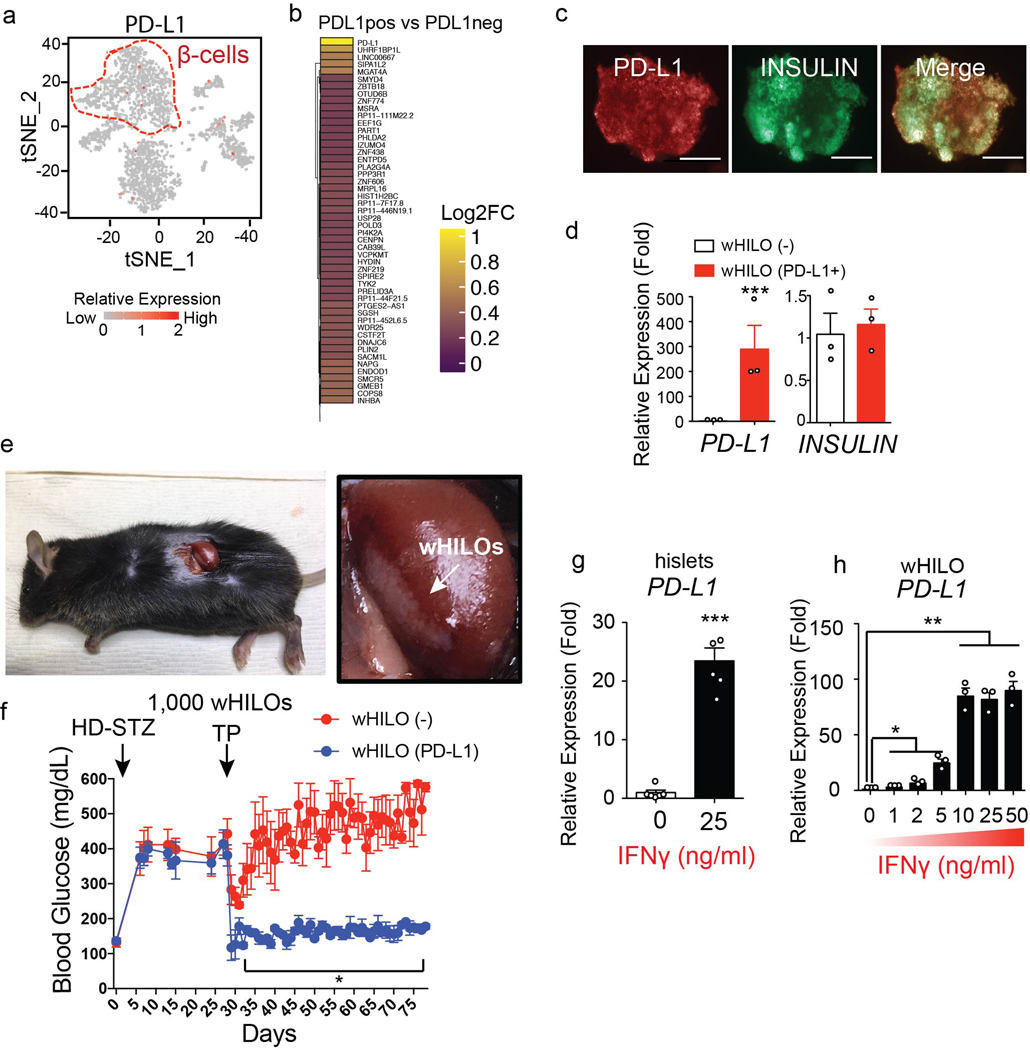
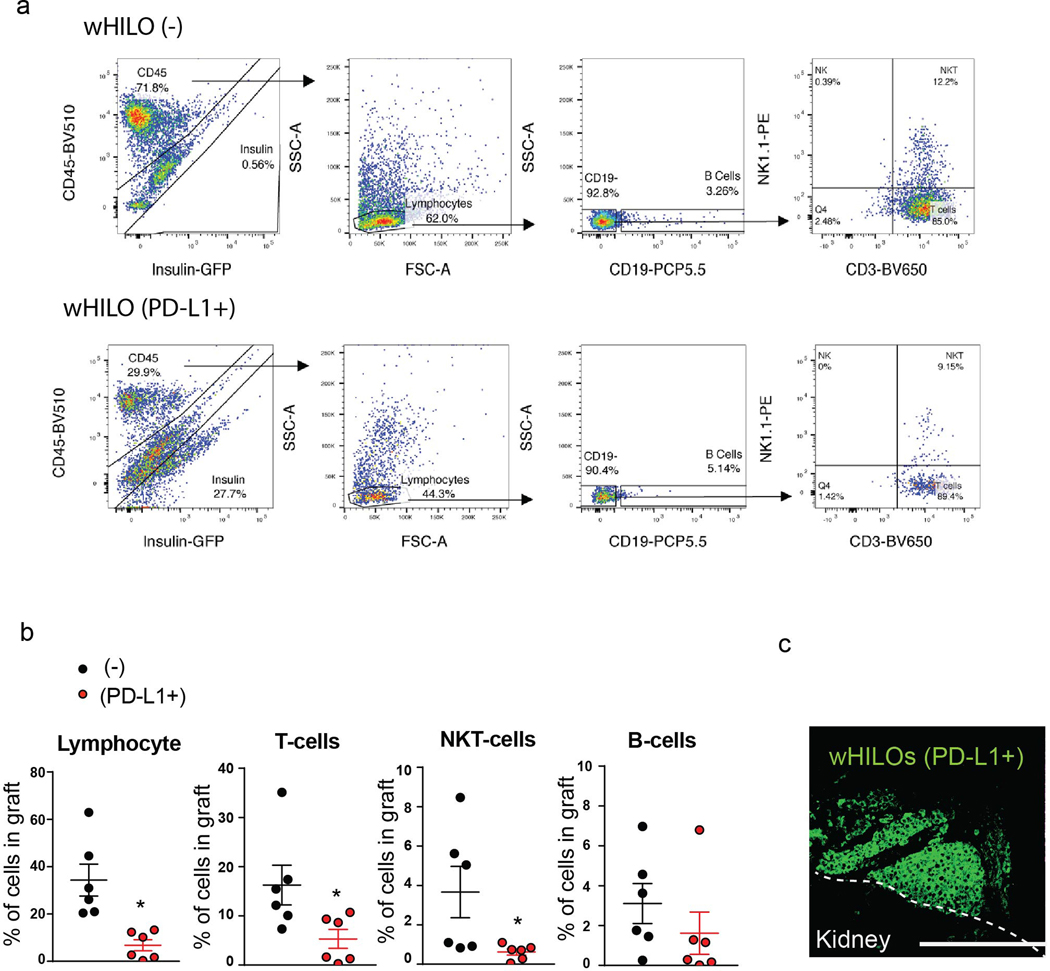
The clinical utility of transplanted islets is limited by both allogenic and autoimmune responses. Interestingly, subsets of cells in healthy islets including a small number of β-cells were found to express PD-L1 (Extended Data Fig. 9a, b), a known determinant of immune tolerance in β-cells15–21, leading to the hypothesis that exogenous PD-L1 expression would protect wHILOs from immune rejection. To explore this notion, PD-L1-expressing hiPSC clones were generated using a lentiviral system and subsequently differentiated into metabolically mature wHILOs as delineated in Figure 1a. Encouragingly, PD-L1 over-expression did not affect insulin expression (Extended Data Fig. 9c, d). Transplantation of wHILOs with and without PD-L1 expression into immune competent diabetic mice restored glycemic control within days of transplantation with similar efficacy (STZ-treated C57BL6J mice, Fig. 2c, d and Extended Data Fig. 9e). However the functionality of wHILOs lacking PD-L1 was progressively lost as seen by the increases in blood glucose levels, while PD-L1+ wHILOs maintained glucose homeostasis for >50 days (Fig. 2d). Furthermore, increasing the number of PD-L1+ wHILOs (transplantation of 1000 wHILOs) normalized blood glucose levels for >50 days (Extended Data Fig. 9f). Flow cytometry analyses of grafts recovered 27 days after transplantation revealed decreased CD45+ immune cells including T and NKT cells in PD-L1+ grafts, as well as negligible insulin-expressing cells in PD-L1- grafts (Fig. 2e, f and Extended Data Fig. 10a–c).
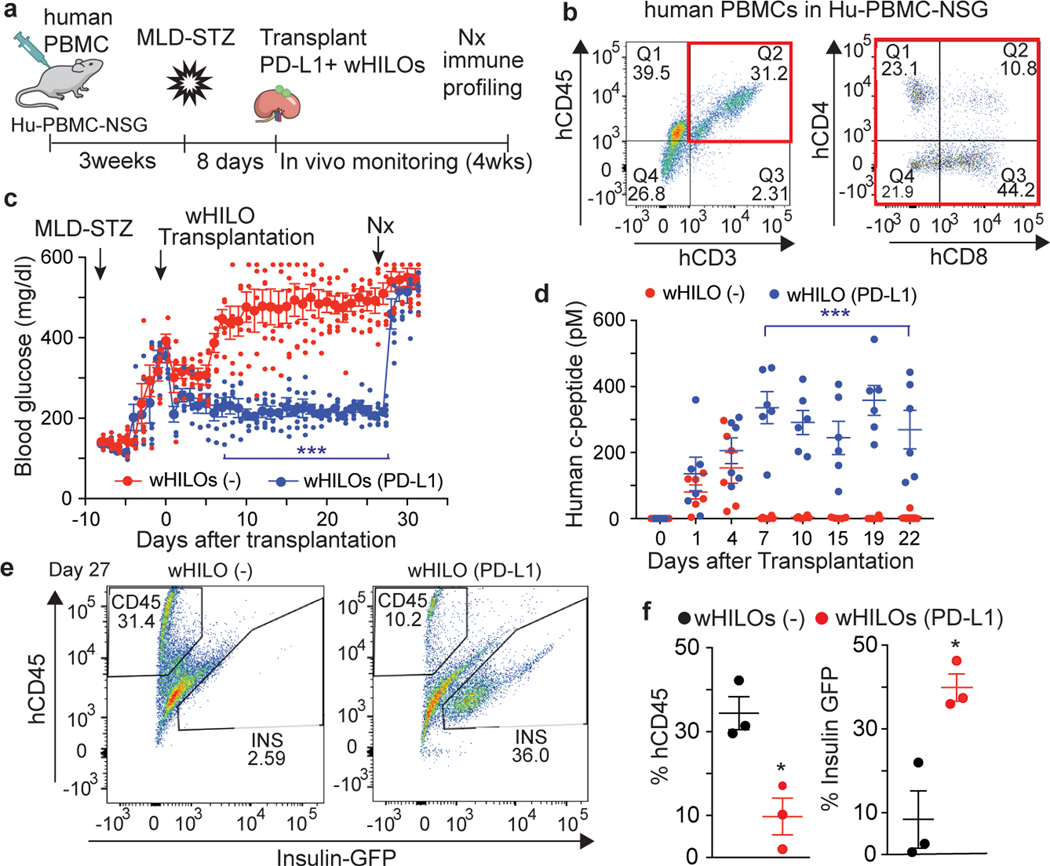
The persistence of wHILO (PD-L1) as xenografts led us to explore their functionality in a model incorporating a reconstituted human T cell repertoire. After confirming the presence of human T cells, HuPBMS-NSG-SGM3 mice were rendered diabetic by multi-low dose STZ treatment (MLD-STZ) and subsequently transplanted with wHILOs (Fig. 3a, b). Transplanted wHILOs (PD-L1) provided sustained blood glucose control compared to those lacking PD-L1 expression, with human c-peptide levels correlating with the extent of glycemic control (Fig. 3c, d). The rapid development of hyperglycemia upon surgical removal of the transplanted kidneys implicated graft-derived insulin as the primary effector (Fig. 3c). Subsequent analysis of the recovered grafts revealed a marked reduction in the number of insulin-expressing cells in the non-immune shielded wHILOs and a corresponding increase in human lymphocytes (Fig. 3e, f).
Fig. 3. wHILOs (PD-L1) provide extended glucose control in humanized mice.
a, Schematic showing transplantation of wHILOs with and without PD-L1 overexpression (500 HILOs per mouse) into multi low dose streptozotocin (MLD-STZ, 50mg/kg/day for 5 days) induced diabetic Hu-PBMC-NSG mice. b, Flow cytometric analysis of human T cells (CD4+ and CD8+ cells in CD45+/CD3+ population) in PBMC from Hu-PBMC-NSG mice (n=15 mice), 3 weeks after human PBMC transplantation. c, Random fed blood glucose levels in MLD-STZ induced diabetic Hu-PBMC-NSG mice after transplantation of wHILOs with or without PD-L1 expression (n=6). d, Serum human c-peptide levels in mice described in (c) (n=6). e, Flow cytometric analysis of insulin-expressing and human CD45+ immune cells recovered from kidney capsule grafts 27 days after transplantation of wHILOs with and without PD-L1 expression. f, Quantification of analyses in (e) (n=3). Error bars represent ± SEM. *p<0.05, **p<0.01, ***p<0.001, one-tailed, student’s paired t test. Data representative (b, e) or compiled from (c, d, f) 2 independent experiments.
Epigenetic memory drives immune tolerant wHILOs
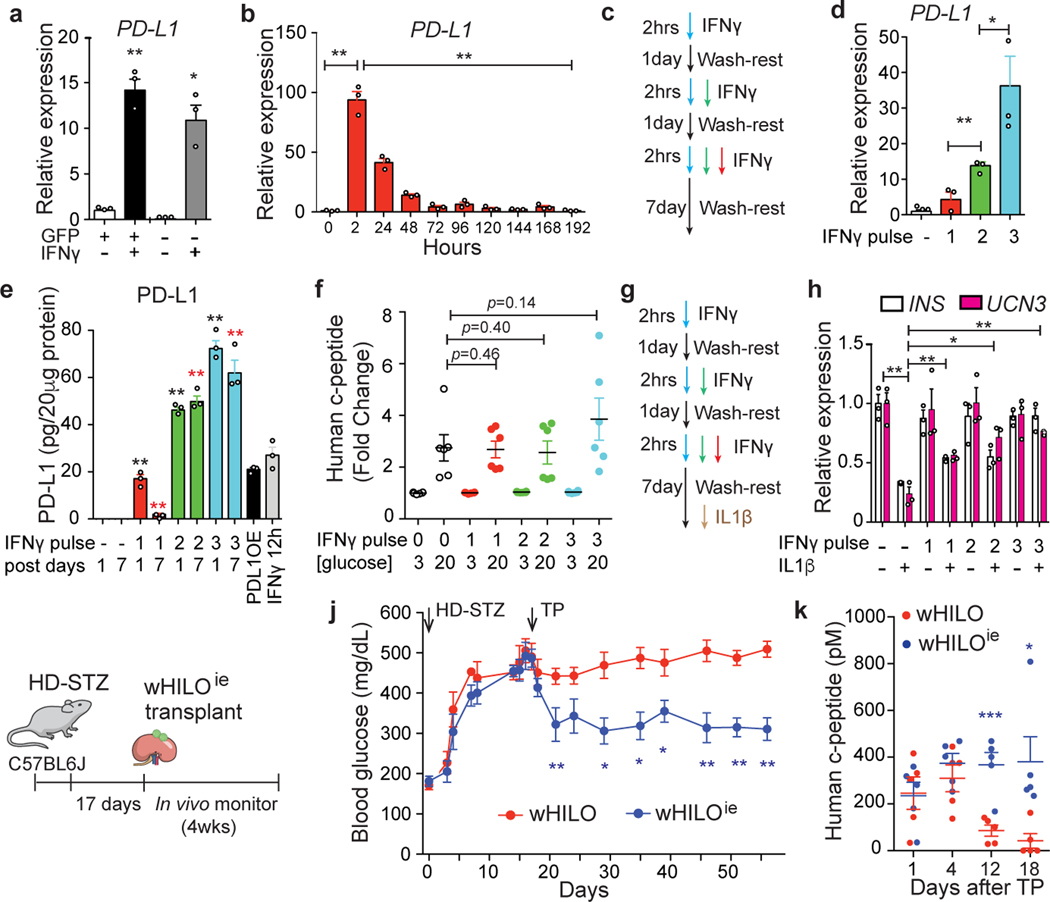
PD-L1 expression is induced by IFNγ stimulation in several cell types as well as multiple cancers and pancreatic islets22,23, however extended exposure to cytokines including IFNγ is known to induce β-cell death and/or dedifferentiation24. To determine if this pathway could be exploited to minimize host immune responses, we initially exposed human islets to IFNγ. Encouragingly, an ~20-fold increase in PD-L1 expression was seen 12 hours after IFNγ treatment (Extended Data Fig. 9g). Equivalent experiments in wHILOs saw a similar induction, with IFNγ inducing PD-L1 expression in both insulin-expressing and non-expressing cells (GFP+ and GFP- cells, respectively, Fig. 4a). Dose-escalating studies in wHILOs identified maximum PD-L1 induction after a 12 hour, 10ng/ml IFNγ exposure (Extended Data Fig. 9h). While a more limited 2 hour exposure at 10ng/ml was sufficient to induce PD-L1, this expression was transient (Fig. 4b). Given that tolerance to inflammatory stimuli such as lipopolysaccharide has been associated with epigenetic changes, we investigated whether sequential IFNγ stimulation could induce a sustained induction of PD-L1. Indeed, repeated short exposures to IFNγ (multiple pulse-stimulated, MPS) led to sustained PD-L1 expression and concomitant increases in protein levels (Fig. 4c–e). Importantly, GSIS functionality was not compromised by MPS IFNγ exposure (Fig. 4f). Furthermore, MPS IFNγ-treated wHILOs were protected against IL-1β-induced β-cell dedifferentiation, as revealed by the expression of β-cell identity markers INS and UCN3 (Fig. 4g, h).
Fig. 4. Enhanced endogenous PD-L1 expression generates immune evasive wHILOs.
a, PD-L1 expression in cells sorted for insulin expression (GFP+ and GFP-, respectively) from wHILOs after IFNγ treatment (10ng/ml, 12 hours). b, Temporal PD-L1 expression in wHILOs after a single IFNγ treatment (10ng/ml, 2 hours). c, Schematic of IFNγ (10ng/ml) pulse treatment. d, PD-L1 expression induced by indicated cycles of IFNγ treatment, 7 days after last treatment. e, PD-L1 protein levels 1 and 7 days after indicated IFNγ (10ng/ml) treatments. PD-L1 overexpressing wHILOs (PDL1OE) and a single 12 h exposure to IFNγ were used as positive control. f, Human c-peptide secretion from IFNγ treated wHILOs in response to 3mM (G3) or 20mM (G20) glucose. g, Schematic of IFNγ treatment in combination with an IL1β challenge (10ng/ml for 24 hours) to induce β cell dedifferentiation. h, INS and UCN3 expression after indicated IFNγ and IL1β treatments of wHILOs. i, Schematic of experimental program. High dose streptozotocin (HD-STZ, 180mg/kg) induced diabetic C57BL6J mice received transplants of 500 wHILOs with or without the IFNγ treatment shown in (c). j, Blood glucose levels in recipient mice after transplantation at day 17 of wHILOs or IFNγ multi pulse-stimulated wHILO (wHILOie) (n=6). k, Serum human c-peptide levels in mice described in (i) (n=5). Error bars represent ± SEM. *p<0.05, **p<0.01, one-tailed, student’s paired t test. n=3 (a,b,d,e,h) and n=6 (e). Data representative (a, b, d, e, f, h) or compiled from (j, k) 3 independent experiments.
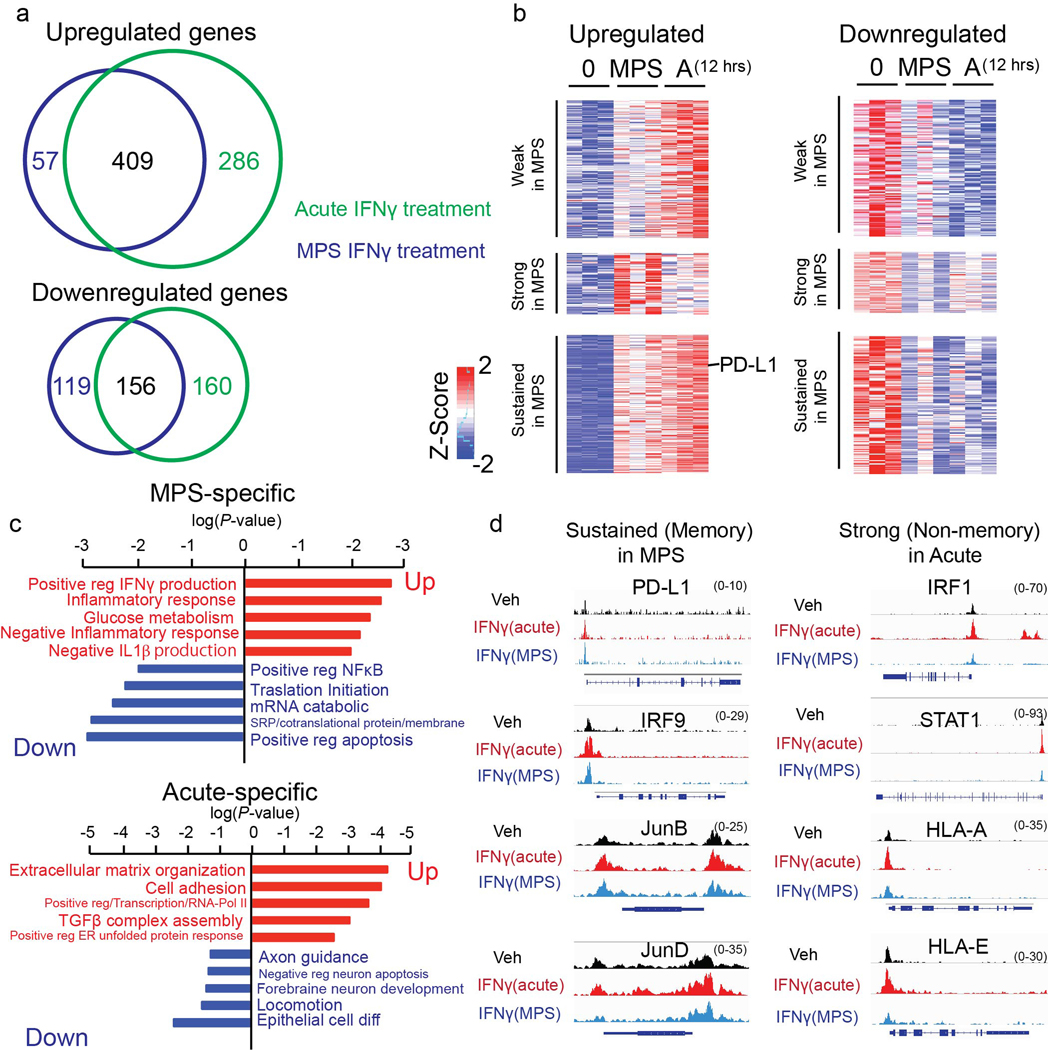
In order to provide mechanistic insight into the IFNγ-driven changes in wHILOs, the genome-wide transcriptional changes induced by acute (12h exposure) and MPS treatments were associated with alterations in chromatin accessibility as measured by ATAC-Seq. Largely overlapping gene sets were induced by the IFNγ treatments that included PD-L1, while approximately half of the downregulated genes were commonly affected (Extended Data Fig. 11a, b). Gene ontology of the commonly upregulated gene set identified IFNγ pathways (data not shown). In contrast, pathways that reflect the cell inflammation status including negative regulation of IL1β production and inflammatory pathways were identified only in the MPS-upregulated gene set, while positive regulation of NFkB signaling and apoptosis were found selectively in the MPS-downregulated gene set (Extended Data Fig. 11c). Overlaying changes in chromatin accessibility revealed persistent increases at gene loci including PD-L1, IRF9, JUNB, and JUND after MPS IFNγ treatment, in agreement with the sustained increases in gene transcript levels (Extended Data Fig. 11d). In contrast, while increased accessibility was seen at IFNγ-responsive genes including IRF1 and STAT1 after the acute treatment, these increases were not sustained in the MPS treatment (Extended Data Fig. 11d).
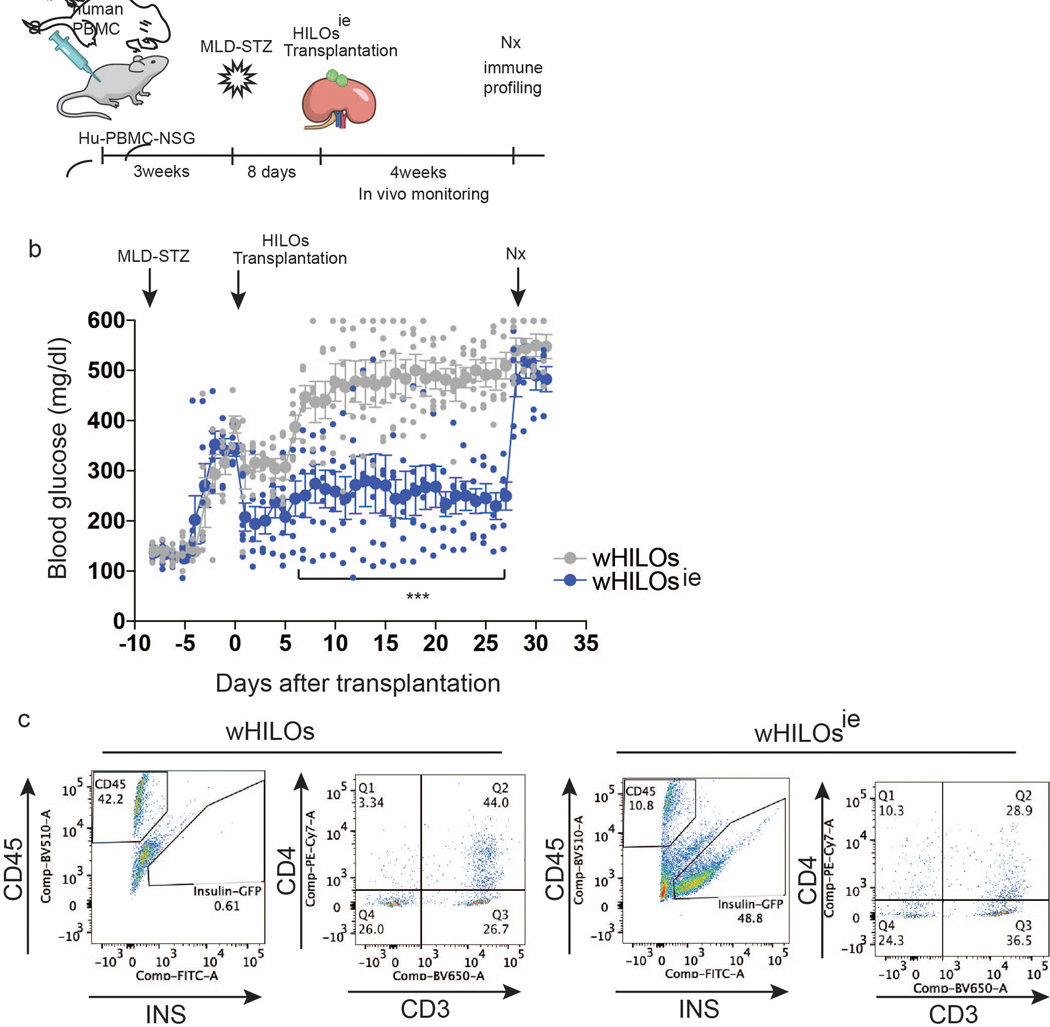
The utility of MPS IFNγ treatment to generate immune evasive wHILOs (wHILOie) was explored in immune-competent, STZ-induced diabetic C57BL6J mice. Notably, transplantation of wHILOie reduced glucose levels for >40 days, while the efficacy of naïve wHILOs (no IFNγ exposure) progressively decreased, in agreement with the reduced human c-peptide serum levels (Fig. 4i–k). Similar results were seen with transplantations in humanized diabetic mice, wherein surgical removal of the recipient kidney led to an abrupt loss of glycemic control (Extended Data Fig. 12a, b). An increase in the number of insulin-expressing cells, accompanied by reduced lymphocyte infiltration and a decrease in the relative number of activated T helper cells (CD4+CD3+) was seen in the recovered wHILOie grafts.(Extended Data Fig. 12c).
In combination, these results suggest that the MPS IFNγ protocol induces an epigenetic memory that leads to cytokine tolerance and sustained de novo PD-L1 expression in wHILOs, and purports to the utility of wHILOie as a therapy to alleviate insulin-dependent diabetes.
Discussion
A combination of genetic and environmental factors underlies the autoimmune destruction of β-cells, and while exogenous insulin provides glycemic control, long term complications associated with diabetes are a continuing concern. The ability to generate glucose-responsive human β-cells suitable for transplantation, in absence of a device, has the potential to significantly improve patients’ lives. Here we describe a protocol that builds upon work from our group1 and others3,4,25,26 that systematically drives the differentiation of pluripotent stem cells into insulin-positive, glucose-responsive β-like cells. Adaptation of this program to 3D cultures facilitated the generation of metabolically mature, immune evasive human islet-like organoids (wHILOie) capable of restoring glucose homeostasis in diabetic, immune-competent mice. Importantly, the identification of WNT4 as a metabolic maturation factor allowed the production of functional HILOs in fully chemically defined media (Fig. 1e,f).
A challenge for stem cell-based therapeutics is autoimmune rejection of transplanted cells 27,28. During antigen presentation, interactions between cytotoxic T-lymphocyte antigen-4 (CTLA-4) and B7 molecules, as well as programmed cell death protein 1 (PD1) and its ligand PD-L1, negatively regulate immune responses in a non-redundant manner. Here we show that wHILOs overexpressing PD-L1 are protected from xenograft (Fig. 2d) and allogenic (Fig. 3c) rejection. Furthermore, immune evasive HILOs with sustained, endogenous PD-L1 expression maintain glucose homeostasis in immune-competent as well as humanized diabetic mice.
Generating patient-derived insulin-producing cells has the potential to further reduce the risk for alloimmune rejection, however clinical-grade autologous transplants are likely prohibitively expensive29. Alternatively, allogenic transplantation of MHC-matched grafts may reduce immune responses, although the threat from alloreactive T cells remains30. MHC matching together with the induction of immune tolerance may provide the most promising strategy for controlling immune responses, ideally without immunosuppressive drugs. While insulin injections and glucose monitoring can effectively manage diabetes in the acute setting, it does not replace the multifunctional role of the islet. The generation of glucose-responsive, immune evasive HILOs offers a physiologic alternative to current immune suppressive cadaveric or device-dependent technologies.
Methods
Maintenance of Mouse lines
Animals were maintained in a pathogen-free animal facility on a 12 hr light-dark cycle at an ambient temperature of 23°C. Water and food were provided ad lib. Experiments used 8–20 week old age- and background-matched male C57BL/6J (Stock No 000664), NOD-SCID mice (NOD.Cg-Prkdcscid Il2rgtm1Wjl/SzJ, Stock No 005557), β cell-specific ERRγ knockout mice1, hu-PBMC-SGM3 mice (referred to as humanized mice. Female NSG™ mice were injected with human peripheral blood mononuclear cells in NSG-SGM3 (Jackson 013062) strain and procedures were performed in accordance with protocols approved by the IACUC and Animal Resources Department of the Salk Institute for Biological Studies. Cohort sizes were determined empirically based on initial studies. Littermates were randomly assigned to experimental arms. STZ treated mice were grouped based on serum glucose levels, and mice with the highest levels utilized for positive control experiments (i.e. mouse and human islet transplantations). No experiment was blinded.
Cell lines
Human induced pluripotent stem cells were derived from HUVECs by the Salk Stem Cell Core. HEK293LTV (Cell Biolabs), HuES8 (Harvard University), H1ES (Wicells), and hiPSC derived Beta like cells (TAKARA, ChiPSC12&ChiPSC22) were routinely tested for mycoplasma contamination. No commonly misidentified cell lines were used.
Generation of human insulin reporter and PD-L1 overexpressing human iPSC lines
To mark β cell specification, human induced pluripotent stem cells (hiPSCs) derived from HUVECs were infected with a human insulin GFP reporter, as previously described1,31. To visualize endogenous insulin promoter activity, CRISPR/Cas9 genome editing was used to introduce GFP into the insulin promoter (Supplementary Table 2). PD-L1-expressing hiPSCs were generated by infecting with a CD274 (PD-L1) lentivirus (abm, LV113090) with puromycin selection. The human UCN3 proximal promoter sequence (−1298/+103) was introduced by In-Fusion cloning (Clontech) into the promoter-less pLV-Cherry-Picker1 backbone (Clontech, 632574) using the ApaI/NotI sites. Primer sequences for PCR amplification of the promoter sequence from genomic DNA were 5’-GTCCATGCTGATCCATCCTT-3’ (forward) and 5’-TGCTTCTCCGGTATTGTTCC-3’ (reverse). A dual reporter line for human UCN3 mCherry and human insulin GFP (hINS-GFP-EF1α-Neo) was generated in hiPSCs.
Virus Production
Lentiviruses were produced using second- or third-generation lentiviral systems in HEK293LTV cell line (Cell Biolabs).
3D Gellan gum culture media
Aqueous solutions of low acyl gellan gum (Kelcogel F GG-LA, Modernist pantry, 0.3% w/v) were sterilized by autoclaving prior to dilution in mTeSR1 or Custom TeSR media (StemCell Technologies, final concentration 0.015%) and the addition of methylcellulose (R&D systems, final concentration 0.3%) and penicillin/streptozocin.
Human multicellular spheroids (MCSs)
Pancreatic endocrine (PE) cells were prepared from human iPSCs as previously described. In brief, HUVEC-derived hiPSCs, obtained from the Salk Stem Cell Core, were maintained on matrigel (BD)-coated dishes in complete Stem TeSR Media at 37°C in a humidified 5% CO2 incubator. Prior to pancreatic differentiation, hiPSC were infected with a human insulin reporter lentivirus (pGreenZero lenti reporter human insulin, System Biosciences) by Spinfection (800g, 1 hour) and then the media was changed to 100ng/ml human Activin (R&D Systems), 3μM CHIR99021 (Selleckchem) in differentiation media (800ml DMEM/F12, 13.28g BSA, 10ml Glutamax, 560mg NaHCO3, 330mg thiamine, 100mg reduced glutathione, 3300 mg Vitamin C, 14μg Selenium, 10ml NEAA, 2ml Trace Element B, 1ml Trace Element C, 7μl β-ME, 2ml DLC, 2ml GABA, 2ml LiCl, 129.7μg PA, Insulin 2mg, made up to 1000ml) for 2 days and then 100ng/ml human Activin in differentiation media for another 2 days (Stage 1, Pancreatic Endoderm). Subsequently, media was replaced with differentiation media with 1μM dorsomorphin (Calbiochem), 2μM Retinoic Acid (Sigma), 10μM SB431542 and 1% of B27 supplement for 7 days (Stage 2). Media was then replaced with differentiation media with 10μM forskolin (Sigma), 10 μM dexamethasone (Stemgent), 10μM TGFβ RI Kinase inhibitor II/Alk5 inhibitor II (Calbiochem or Enzo), 10μM Nicotinamide (Sigma), 1μM 3,3’,5-Triiodo-L-thyronine sodium salt (T3) and 1% of B27 supplement for 4–5 days (day15-day19, Pancreatic endocrine progenitors). Media was replaced every day (stage 1), and then every other day (stage 2 & stage 3). Primary HUVECs cells and human adipose-derived stem cells (hADSC) (Invitrogen or PromoCell) were cultured in 15cm dishes with EBM Media (Ronza, cc-3121) or MesenProRS Media (GIBCO, 12747–010 or Preadipocyte Growth Medium Kit, C-27417), respectively at 37°C in a humidified 5% CO2 incubator. For co-culturing experiments, pancreatic endocrine progenitors derived from human iPSC were treated with Accutase, while HUVECs and hADSC were treated with TrypLE (GIBCO, 12604–013) and cells collected into 50ml tubes. hiPSC-EP (1×10⁶ cells), HUVECs (7×10⁶ cells) and hADSCs (1–2×10⁵ cells) were co-cultured in a single well of a 24 well plate with 300μl of matrigel. For MCS generation, hiPSC-EP (day 15-day 21, 1×10⁶ cells), HUVECs (7×10⁶ cells) and hADSCs (1–2×10⁵ cells) were co-cultured in 3D Kelco Gel Custom TeSR with 10μM forskolin (Sigma), 10μM dexamethasone (Stemgent), 10μM TGFβ RI Kinase inhibitor II/Alk5 inhibitor II (Calbiochem or Enzo), 10μM Nicotinamide (Sigma), 1μM 3,3’,5-Triiodo-L-thyronine sodium salt (T3) and 1% of B27 supplement, R428 (2μM), Zinc sulfate (10μM) and N-Cys (1mM). Media is changed every other day, with islet-like clusters forming within a few days.
Human pancreatic islet-like organoid (HILO) cultures
hiPSCs were cultured in matrigel-coated plates. Single cell suspensions were prepared using Accutase, washed in PBS, and collected by centrifugation (1000–1300rpm for 5 min). Cells were re-suspended with 3D Kelco Gel Stem TeSR™ Base Media in the presence of the ROCK inhibitor (10μM Y-27632, StemCell) for 5 to 7 days until spheroids reached 50–100 μm diameter. Media was then replaced with 0.015% Kelco gel containing 0.3% methylcellulose and supplemented with 100 ng/ml human Activin A (R&D Systems), 3μM CHIR99021 (Axon or Selleckchem) in differentiation media (S1) for 1 day and then 100ng/ml human Activin in differentiation media (S1) for another 2 days (Stage 1, Definitive Endoderm). Subsequently media was replaced with differentiation media (S2) with 50ng/ml FGF7 (R&D Systems) for 2 days, differentiation media (S3) with 50ng/ml FGF7, 0.25μM SANT-1 (Sigma), 1μM Retinoic Acid (Sigma), 100nM LDN193189, 10μM Alk5 inhibitor II and 200nM of the α-Amyloid Precursor Protein modulator TPB for 3 days, then 50ng/ml FGF7, 0.25μM SANT-1 (Sigma), 1μM Retinoic Acid (Sigma), 100nM LDN193189, 10μM Alk5 inhibitor II and 100nM of the α-Amyloid Precursor Protein modulator TPB for 2 days. Subsequently media was replaced with differentiation media (S4) with 0.25μM SANT-1, 50nM retinoic acid, 100nM LDN193189, 10μM Alk5 inhibitor II, 1μM T3 for 3 days. Subsequently media was replaced with differentiation media (S5) with 100nM LDN193189, 100nM γ-secretase inhibitor XX (GSiXX, Millipore), 10μM Alk5 inhibitor II, 1μM T3 for 7 days. Subsequently media was replaced with differentiation media (S5) with 10μM Trolox (Calbiochem), 2μM R428 (Selleckchem), 1mM N-acetyl cysteine, 10μM Alk5 inhibitor II, 1μM T3 for an additional 7 to 20 days. After confirmation of insulin expression by qPCR or reporter activity (typically days 20–30), media was changed to differentiation media (S5) with 10μM Trolox (Calbiochem), 2μM R428 (Selleckchem), 1mM N-acetyl cysteine, 10μM Alk5 inhibitor II, 1μM T3 and 100ng/ml recombinant human WNT4 (rhWNT4) (R&D Systems) with or without the addition of laminins (LM-511/521 and LM-411/421) for 5–10 days.
WNT5A Conditional Media
WNT5A-producing fibroblasts (ATCC CRL-2814) and control fibroblasts (ATCC CRL-2648) were cultured with DMEM containing 10% FBS and 1% penicillin/Streptomycin (Complete Media). Upon reaching confluency, cells were washed with PBS prior to incubation in Complete Media for one week. Conditioned media was subsequently collected, filtered through a 0.2μm sterile filter, and frozen at −80C in 50ml aliquots. Conditioned media was mixed with Differentiation Media (S5 with 10μM Trolox, 2μM R428, 1mM N-acetyl cysteine, 10μM Alk5 inhibitor II, 1μM T3) at 1:1 ratio, then used to treat HILOs for 5–10 days.
PD-L1 induction in human islets and wHILOs
PD-L1 expression was induced by recombinant human IFNγ (R&D Systems, 285-IF, 2–12 hours treatment at 1–50ng/ml final concentration). For acute treatment, wHILOs were treated with 10ng/ml IFNγ in the differentiation media (S5 with 10μM Trolox, 2μM R428, 1mM N-acetyl cysteine, 10μM Alk5 inhibitor II, 1μM T3 and 100ng/ml rhWnt4) for 2 hours. Cells were then washed twice with PBS prior to culturing in differentiation media (S5 with 10μM Trolox, 2μM R428, 1mM N-acetyl cysteine, 10μM Alk5 inhibitor II, 1μM T3 and 100ng/ml rhWnt4) (single pulse stimulation). IFNγ exposure was repeated 3 times with washing and 24 hours resting time in differentiation media (S5 with 10μM Trolox, 2μM R428, 1mM N-acetyl cysteine, 10μM Alk5 inhibitor II, 1μM T3 and 100ng/ml rhWnt4) between each IFNγ exposure (MPS stimulation) to generate wHILO (MPS). After the final IFNγ pulse, cells were cultured in the tissue culture incubator for a week prior to the RNA-seq analyses (Extended Data Fig. 11a–c), ATAC-seq analyses (Extended Data Fig. 11d) and the transplantation into STZ-induced diabetic C57BL6J mice (Fig. 5j) or humanized mice (Extended Data Fig. 12b).
Isolation of pancreatic Islets
Mouse pancreatic islets were isolated as previously described32 with slight modifications. Briefly, 0.5 mg/ml collagenase P (Roche REF11213873001, diluted in HBSS buffer, GIBCO, 14170–112) was injected through the common bile duct, and the perfused pancreas dissected and incubated at 37°C for 21 min. Digested exocrine cells and intact islets were separated via centrifugation over Histopaque-1077 (Sigma, H8889, 900xg for 15 min), and intact islets manually selected. Human islets were provided by the Integrated Islets Distribution Program under an approved protocol.
Insulin/c-peptide secretion assays
Insulin release from intact islets was monitored as previously described1. Briefly, overnight-cultured isolated pancreatic islets (RPMI-1640 supplemented with 10% (v/v) fetal bovine serum and 1% (v/v) Antibiotic-Antimycotic (Gibco)) were pre-cultured at 37°C for 30 min (Krebs-Ringer bicarbonate buffer (KRBB) containing 129.4 mM NaCl, 3.7 mM KCl, 2.7 mM CaCl2, 1.3 mM KH2PO4, 1.3 mM MgSO4, 24.8 mM NaHCO3 (equilibrated with 5% CO2, 95% O2, pH7.4), 10mM HEPES and 0.2% (v/v) BSA (fraction V, Sigma) with 3 mM glucose). Pancreatic islets were incubated in Krebs-Ringer bicarbonate HEPES buffer (KRBH) buffer (500 μl/10 islets) with 3 mM or 20 mM glucose for 30 minutes, the islets were pelleted, and secreted insulin levels determined in the media by ELISA (Rat/mouse Insulin ELISA KIT (Millipore) and ultrasensitive human Insulin ELISA KIT or ultrasensitive human c-peptide ELISA Kit (Mercodia) for mouse and human islets, respectively). For human iPSC-derived cells (1×10⁶ cells/well in 24 well) were pre-cultured in 3mM glucose KRBH buffer (500 μl/well). Cells were then incubated in KRBB (200 μl/well) with 3 mM or 20 mM glucose for 30 min, and c-peptide levels determined in the media by human c-peptide ELISA KIT (Millipore) after pelleting of the cells. For 3D cultured HILOs, size matched (100–300 μm diameter) HILOs were pre-cultured with KRBH buffer with 3mM glucose for 30 minutes prior to incubated in KRBH buffer (500 μl/20 HILOs) with 3 mM or 20 mM glucose for 30 minutes. Secreted human c-peptide or human insulin levels were measured in the media by ELISA ultrasensitive (human Insulin ELISA KIT or ultrasensitive human c-peptide ELISA Kit (Mercodia)).
Oxygen Consumption and Extracellular Acidification Rates
Oxygen consumption rate (OCR) and extracellular acidification rate (ECAR) were recorded in 24-well plates using an XF24 sea horse (Seahorse Biosciences). Briefly, 70 size-matched human islets, hiPSC spheroids, or HILOs were pre-cultured in 3 mM glucose XF DMEM media (pH 7.4) with 1mM sodium pyruvate (Base Media) for 1 hr prior to transfer to XF24 islet culture plates in Base Media. OCRs (reported as percent change compared to 3 mM glucose) were recorded during the incremental addition of glucose, up to a final concentration of 20 mM glucose. Subsequently, mitochondrial stress reagents (oligomycin, Fccp, Rotenone, and Antimycin A), were added as instructed in the Mitostress Kit (Seahorse Biosciences).
Islet and HILO Transplantation Studies
Immuno-deficient NOD-SCID, C57BL6J and Hu-PBMC-SGM3 mice were purchased from Jackson Laboratory and maintained in autoclaved cages in a SPF facility at the Salk Institute. Mice were rendered diabetic by a single high dose (180mg/kg) or 5 times multi low dose (MLD, 50mg/kg) injection of streptozotocin (STZ; i.p., Sigma S0130–500MG). One week after STZ injection, mice with blood glucose levels higher than 300 mg/dl were used as transplant recipients. Human and mouse islets (200–500 islets or 500–1,000 IEQ for mouse islets, 500–1,000 islets or 1,000–2,000 IEQ for human islets per animal) or HILOs (500 clusters) were re-suspended in 200 μl RPMI-1640 media, loaded into laboratory tubing (SiLastic, 508–004), and centrifuged (400 × g for 1–2 min) to generate cell clusters in the center of the tubing. Cell clusters (~30–50 μl) were transplanted under the kidney capsules in 8–16 week old STZ-injected diabetic mice. Ketamine (80 mg/kg) and xylazine (10 mg/kg) were used as surgical anesthetics and mice were placed on 37°C heating pads to recover. Blood glucose was monitored using a Nova Max Plus. Nephrectomies (Nx) for graft removal experiments were carried out to confirm the efficacy for glucose regulation in the transplanted wHILOs. The kidney with graft was ligated at the renal hilum using 4–0 silk (LOOK, SP116), and then resected. Removed grafts were processed for analyses of immune profiling.
ATAC-seq
ATAC-seq was performed on 50,000 GFP+ cells purified using Fluorescence Activated Cell Sorting (FACS) from HILOs treated with PBS or 100ng/ml rhWNT4 from day 27 to day 34, as described33. Reads were aligned by Bowtie to hg19 and peaks were called by Homer using the default settings. Differential peaks and motif analyses from 2 biological duplicates were identified using HOMER34. Detailed methods for HOMER are freely available at http://http://homer.salk.edu/homer/. Briefly, the program searches against the target and background sequences for enrichment of known motifs, returning motifs enriched with a threshold of 1.5 fold change and p-value less than 0.05. Promoter regions, defined as 1kB upstream from the transcription start site, of genes with enhanced chromatin accessibility upon Wnt4 treatment, were interrogated for enriched motifs of 8–16 bp using HOMER motif analysis.
Bulk RNA-Seq library generation
Total RNA was isolated from cell pellets treated with RNAlater (Invitrogen) using the RNeasy micro kit (Qiagen) and treated with DNaseI (Qiagen) for 30 min at room temperature. Sequencing libraries were prepared from 100–500ng total RNA using the TruSeq RNA Sample Preparation Kit v2 (Illumina) according to the manufacturer’s protocol. Briefly, mRNA was purified, fragmented, and used for first- and second-strand cDNA synthesis followed by adenylation of 3’ ends. Samples were ligated to unique adapters and PCR amplified. Libraries were then validated using the 2100 BioAnalyzer (Agilent), normalized and pooled for sequencing.
High-throughput sequencing and analysis
RNA-Seq libraries prepared from 3 biological replicates for each experimental condition were sequenced on the Illumina HiSeq 2500 using bar-coded multiplexing and a 100bp read length. Image analysis and base calling were automatically generated with the Illumina HiSeq Real-Time Analysis Software. This yielded a median of 29.9M usable reads per sample. Short read sequences were mapped to a UCSC hg19 reference sequence using the RNA-Seq aligner STAR35. Known splice junctions from hg19 were supplied to the aligner and de novo junction discovery was also permitted. Differential gene expression analysis, statistical testing and annotation were performed using Cuffdiff 236. Transcript expression was calculated as gene-level relative abundance in fragments per kilobase of exon model per million (fpkm) mapped fragments and employed correction for transcript abundance bias37. RNA-Seq results for genes of interest were also explored visually using the UCSC Genome Browser. Heatmaps were generated by R-Script with heatmap.2 (gplot) software or Cluster with Javatree view software. Scale of heatmaps was determined by Z-score (Figure 2a, 3d).
Droplet-based single-cell RNA sequencing
3 biological replicates (200 clusters per replicate) of hiPSC-derived endocrine progenitors (day 15), HILOs, and WNT4-treated HILOs (100ng/ml rhWNT4 for 5 days), as well as human islets (IIDP donor ID 1874) were dissociated into single cell suspension using TrypLE. Single cells were processed through the Chromium Single Cell Platform using the GemCode Gel Bead, Chip and Library Kits (10X Genomics) as per the manufacturer’s protocol. In brief, 8800 single cells were sorted into 0.4% BSA in PBS for a targeted 5000 cell recovery. Cells were transferred into Gel Beads (Chromium Single Cell 3” v2) in Emulsion in the Chromium instrument, where cell lysis and barcoded reverse transcription of RNA occurred, followed by amplification, shearing and 5′ adaptor and sample index attachment. Libraries were sequenced on an Illumina HiSeq 4000.
scRNA-seq data analysis
Initial data processing, including de-multiplexing, alignment to the GRCh38 reference transcriptome from 10X Genomics and unique molecular identifier (UMI)-collapsing, were performed using Cell Ranger software (10x Genomics, ver2.0.2). An overview of sample information was generated from the results of Cell Ranger pipelines (Supplementary Table 3). R studio (https://www.rstudio.com/), Cell Ranger R Kit, Seurat and other custom R scripts were used. Clustering of cells was performed using the Seurat R package in two iterative rounds of principal component analysis. Cells with unique gene counts less than 200 and anomalously high mitochondrial gene expression (cells with>10% mitochondrial genes) were removed (FilterCells function) prior to normalization of digital gene expression matrices by total expression, multiplied by a scale factor (default setting of 10,000) and log-transformed (NormalizeData function). A set of variable genes were then identified by binning the average expression of all genes and dispersion (variance divided by the mean) for each gene, placing these genes into bins, and then calculated z-score for dispersion within each bin (FindVariableGenes Function). Linear dimensional reduction was performed using the default setting of RunPCA and the principal components were evaluated for statistically significant gene expression signals using the Jackstraw method (JackStraw function, data not shown). At most, 12 principal components were used in this second round of clustering. t-distributed stochastic neighbor embedding (t-SNE) mapping was used to visualize scRNA-seq results. Clustered cell populations were classified and the top 10 differentially expressed genes identified (FindAllMarkers function). Cell types within the clustered populations were verified by the expression of canonical marker genes including insulin (β cells), glucagon (α cells), somatostatin (δ cells), pancreatic polypeptide (γ cells), ghrelin (ε cells), Prss1 (aciner cells), Krt19 (duct cells), and Acta2 (stellate cells). scRNA-seq data from WNT4-treated HILOs (4840 cells) and human islets (7248 cells) were combined in 1 Seurat object and the highly variable genes identified as described above. Cell types within the clustered populations were identified by reference to differentially expressed genes in human islet cells. Seurat FindIntegrationAnchors and IntegrateData functions with canonical correlation analysis (CCA) were used to integrate datasets including HILO, wHILO and human islets, and gene expression count was restored with Single-cell Analyses Via Expression Recovery (SAVER). Differentially expressed genes between wHILOs and human islets in each defined cluster were identified using FindMarkers (Seurat ver 2.0). Default Seurat setting were used to examine the expression in single cells in clusters. ERRγ and insulin positive cells were extracted using WhichCells (expression cutoff > 0.1), and violin plots generated using VlnPlot function.
All parameter settings including minimum number of read and minimum gene number are specified in Supplementary Table 2. We utilized MAGIC38 to impute gene expression data in the matrices from the Seurat object. Rmagic (R package for MAGIC) was implemented with the recommended t settings from its GitHub repository (including optimal t selection, t=4, k=60, npca=20). The restored matrix of expression was utilized in order to examine gene expression and fold-changes using violin plots and heatmaps. To identify significant gene changes among multiple datasets, double positive cells (e.g. ESRRG and INS) were filtered out using WhichCells function after RunALRA (Seurat v3 wrappers). Detailed violin plot statistics for Extended Data Figs. 2d, 8b and 8i are provided in Supplementary Table 5.
Software and program for bioinformatics analysis
Software or program listed below were used for genomic data analysis
R studio (https://www.rstudio.com/)
Cell Ranger R Kit (https://support.10xgenomics.com/single-cell-gene-expression/software/pipelines/latest/rkit)
Seurat (https://satijalab.org/seurat/)39,40
DAVID (https://david.ncifcrf.gov/home.jsp) 42
GOplot (https://wencke.github.io) 43
UCSC genome browser (http://genome.ucsc.edu) 34
Homer (http://homer.ucsd.edu/homer/)
Immunohistochemistry (IHC)
Immunohistochemistry of frozen or paraffin-embedded sections of pancreas, human islets, and human islet-like organoids (HILOs) was performed with antibodies to insulin (1/100, Abcam ab7842), c-peptide (1/100, Abcam ab30477), glucagon (1/100, Abcam ab10988), somatostatin (1/100, Abcam ab103790), pancreatic polypeptyde (1/100, Abcam, ab113694), NKX2–2 (1/100, DSHB, 74.5A5), NKX6–1 (1/100, DSHB, F55A12), MAFA (1/100, Abcam, ab26405), MAFB (1/100, Abcam, ab66506), PDX-1 (1/100, R&D, AF2419), CHGA (1/100, Abcam, ab15160), SYNAPTOPHYSIN (1/100, Biogenex, MU363-UC) and PD-L1 (1/100, Abcam, ab20592). For MAFA and MAFB, signal amplification was performed using TSA-Cy3 kit (Akoya Biosciences, SAT704A001EA). Secondary antibodies were coupled to Alexa 568, 647 (Life Technologies) and visualized by confocal microscopy (ZEISS) or fluorescence microscopy. Hoechst 33342 (Thermo Scientific, 62249, 1μg/ml final concentration) was used for nuclear staining.
Flow cytometry
Clusters at indicated stages were dissociated with TrypLE (GIBCO) with 20μg/ml DNase for 12 min at 37°C and then fixed with 4% PFA for 10 min at room temperature. Clusters were then permeabilized with 0.2 % Triton X for 10 min, blocking with 10% goat serum for 30 min and stained for various intracellular markers with antibodies, c-peptide, (1/100, abcam, ab30477), PDX-1 (1/100, BD, 562161), NKX6–1 (1/100, BD, 563338), Chromogranin A (1/100, BD, 564583), MAFA (1/100, abcam, ab26405), MAFB (1/100, abcam, ab66506), Glucagon (1/100, abcam, ab82270), Somatostatin (1/100, abcam, 108456) for analysis BD Biosciences LSRII. Data were analysed by FlowJo software. Secondary antibodies for c-peptide, Glucagon and Somatostatin were coupled to Alexa 647 (Life Technologies).
Electron Microscopy analyses
Human islets and HILOs were pelleted in 2% low melting point agarose and subsequently fixed in 2.5% glutaraldehyde with 2% paraformaldehyde in 0.15M cacodylate buffer containing 2mM calcium chloride (pH 7.4) for one hour at 4°C. Excess agarose was removed and the pellet washed in buffer prior to secondary fixing in 1% osmium tetroxide/0.3% potassium ferrocyanide in buffer. After washing in water, the pellet was en bloc stained with 2% uranyl acetate followed by graded dehydration in ethanol (35%, 50%, 70%, 90%, 100%, 100%). Samples were then rapidly infiltrated in Spurr’s resin using a Pelco BioWave microwave processing unit (Ted Pella, Redding, CA), embedded in Pelco Pyramid tip mold (Ted Pella, Redding, CA), and cured at 60°C overnight. 70nm ultrathin sections were cut on a Leica UC7 ultramicrotome (Leica, Vienna) and examined on a Libra120 (Zeiss, Oberkochen, Germany) at 120V.
Immune profiling of transplanted HILOs
Transplanted HILOs were harvested 26 days post transplantation and dissociated into single cells using TrypLE. The cells were stained by Zombie-UV staining Dye (BioLegend, 77474) to assess live vs. dead status. After blocking common epitope found in extracellular regions of mouse Fc-receptors by Fc block (Anti-mouse CD16/CD32 (Fc Shield) (70–0161-U500) staining, the antibodies (1:100 dilution) to the cell surface markers CD19 (PerCP/Cy5.5 anti-mouse CD19, BioLegend, 115533), Nk1.1 (anti-mouse Nk1.1 PE, eBioscience, 12–5941-81), CD45 (brilliant violet510 anti-mouse CD45, BioLegend, 103138), CD3 (brilliant violet650 anti-mouse CD3, BioLegend, 100229), Cd11b (anti-human/mouse APC-cyanine, TONBO, 25–0112U100) were used for FACS-based immune profiling. For flow cytometry analyses, data was collected using a BD Biosciences LSRII. For cell sorting, a BD Influx was used (100 micron nozzle tip and 1x PBS sheath fluid with sheath pressure set to 18.5PSI) with sample and collection cooling set to 4 degrees. Viable (Zombie-UV dye negative) single cells were selected for FACS or analyses using Forward scatter (FSC) and Side scatter (SSC) gating, followed by pulse-width discrimination for FSC and SSC.
Quantitative RT-PCR analysis
Total RNA was extracted using TRIzol (Invitrogen) and RNeasy (Qiagen). Reverse transcription was performed with a SuperScript III First-Strand Synthesis System (Invitrogen) or PrimeScript RT reagent kit (TAKARA). Real time quantitative RT-PCR (qPCR) was performed using SYBR Green (Bio-Rad). Primers information is listed in Supplementary Table 4.
Statistics and reproducibility
Data analysis was performed using Graphpad Prism version 7 or Microsoft Excel. Results are expressed as the mean ± SEM. Statistical comparisons were made using student’s paired t test. Statistically significant differences are indicated as *p < 0.05, **p<0.01, ***p<0.001. The sample size (n) indicates the total number of independent biological samples. Experimental and technical triplicates were performed for all qPCR analyses. HILO generation in 3D cultures was performed >50 times. For in vitro GSIS (Fig. 1g, Extended Data Fig. 3e, f, j) and in vivo transplantation studies (Fig. 2d, Fig. 3c, Fig. 4j, Extended Data Fig. 12b), GFP and INS (Ct <20), UCN3 (Ct < 28), MAFA (Ct < 30), ESRRG (Ct < 30) expression in HILOs was confirmed prior to the experiments.
Extended Data
Extended Data Fig. 1. Cellular crosstalk drives functional maturation of hiPSC-derived β-like cells.
a, Principal Component analysis of transcriptomes from human iPSCs (hiPSCs), primary human pancreatic epithelial cells (hPanc Epithelial), human adipose-derived stem cells (hADSCs), human pancreatic fibroblasts (hPanc Fibroblast), human umbilical vein endothelial cells (HUVECs) and human pancreatic microvascular endothelial cells (hPanc Endothelial) (n=3) b, Time course of human adipose-derived stem cell (hADSC) culture in Matrigel (1:1 dilution in hADSC media, 2 million cells in 300μl) showing intrinsic self-organization. Scale bar 1mm. c, Schematic for multi cellular islet-like spheroids (MCS) and islet-like spheroid (IS) generation. hiPSC-derived endocrine progenitor (EP) were co-cultured with hADSC and endothelial cells (EC, HUVECs) in gellan gum-based 3D culture system (left). MCS generated in Matrigel showing the incorporation of ECs (Lentivirus-mCherry expression) and insulin expression (Lentivirus-GFP, right). Scale bar 100 μm. d, MCS cultured in 3D gellan gum system showing insulin expression (Lentivirus-GFP, upper panel). Electron microscopy images of MCS showing insulin granules (lower right) and lipid droplets in hADSC (lower right). e, Gene expression in sorted insulin-expressing cells (GFP+) from IS, MCS, or human islets (hislets) (n=3) f, Human c-peptide secretion in response to 3mM (G3) or 20 mM (G20) glucose from IS, MCS and hislets (n=9) g, Random fed blood glucose levels in STZ-induced diabetic NOD-SCID mice after sham treatment or transplantation of MCS (500) or human islets (n=3, 3 and 5 respectively). h, Serum human c-peptide levels during feeding, fasting, and refeeding cycles in mice 4 weeks after transplantation (n=3 per group). i, Heatmap of expression changes during hADSC culture in Matrigel (left). Most significantly affected gene ontology category in indicated gene clusters (right) (n=3) j, Temporal expression of WNTs during hADSC self organization shown in (b) (n=3) Error bars represent ± SEM. *p<0.05, **p<0.01, ***p<0.001, one-tailed, student’s paired t test. Data representative of 3 independent experiments (b, d, e, f, g) or experimental triplicates (a, h, i, j).
Extended Data Fig. 2. WNT expression in human islets.
a, Heatmap of relative expression of WNTs in human islets (n=5). b, tSNE clustering of human islet single cell transcriptomes (n= 3245). Annotated cell types assigned based on known marker gene expression. c, Heatmap of expression of top 10 signature genes in human islet cell clusters from Fig. 1b. d, Single cell expression of signature hormonal and cell type-specific genes in human islets. e,f, Single cell (e) and violin plots (f) of WNT2B, WNT4, WNT5A, WNT7A, WNT7B and WNT9A expression in human islets, statistics provided in Supplementary Table 5. Data from 3 pooled human islets (b-f).
Extended Data Fig. 3. Phenotypic and genotypic characterization of HILOs.
a, Schematic of CRISPR-Cas9 knock-in for endogenous human insulin promoter-driven GFP expression in hiPSC. b, Representative differential interference contrast (DIC) images of wHILOs with insulin-GFP and UCN3-RFP expression (scale bar, 100μm, n=3). c, Relative expression of ISL1, SYT4, PDX1, GCK, NEUROD1, NKX2–2, INS, NKX6–1, MAFA, MAFB and UCN3 in wHILOs and human islets determined by qPCR (n=8 per sample type). d, Extracellular acidification rate (ECAR) measured in day 0 hiPSC spheroids (purple), PBS-treated HILOs (green), WNT4-treated HILOs (red) and human islets (blue) (n=3) e, Kinetics of human c-peptide secretion from WNT4-treated HILOs in response to progressive exposure to 3 mM glucose, 20 mM glucose, 20 mM glucose + 100 nM GLP-1, 3 mM glucose, and 3 mM glucose + 20 mM KCl. f, Glucose-stimulated human c-peptide secretion from wHILOs treated with and without XAV939 to promote β-catenin degradation (XAV939, 1μM for 3 days) (n=8) g, Temporal gene expression (NANOG, NGN3, PDX1, INS) during differentiation of hiPS, HUES8 and H1ES cells to HILOs (upper panel). Insulin-driven GFP expression in day 21 HILOs derived from HUES8 (lower panel, scale bar 100 μm). h, in vitro c-peptide secretion in response to 3 mM (G3) and 20 mM (G20) glucose in wHILOs from HUES8 and H1ES (n=3) i, Schematic depicting culture conditions for commercially available hiPSC-derived β-like cells (left) and light microscopy image of cultured cells (right, scale bar 100 μm). j, in vitro c-peptide secretion in response to 3 mM (G3) and 20 mM (G20) glucose from cultures described in (i) (n=8) k, Blood glucose levels in STZ-induced diabetic NOD-SCID mice. Transplantation (TP) of 500 wHILOs, hislets, or sham surgery was performed at day 3 (n=7, 6, and 3, respectively). l, Gene ontology of transcriptional changes induced by WNT4 treatment (100ng/ml WNT4 from day 26 to day 33) in wHILOs. Error bars represent ± SEM. *p<0.05, **p<0.01, ***p<0.001, one-tailed, student’s paired t test. Data representative of 3 independent experiments (b-h, i lower panel, k) or experimental triplicates (i upper panel, l).
Extended Data Fig. 4. WNT4 promotes mitochondrial maturation of HILOs.
a, Representative images of insulin-GFP expression and MitoTracker staining (red) in PBS- and WNT4-treated HILOs (scale bar, 100μm). b, Flow cytometry quantification of insulin expression (GFP) and mitochondrial content in HILOs treated with recombinant human WNT4 (rhWNT4), WNT5A (rhWNT5A), or conditioned media (CM) from control or WNT5A overexpressing fibroblasts (n=3) c, Venn diagram showing overlap between WNT4-induced increases in chromatin accessibility in GFP+ cells and increases in HILO gene expression (upper panel), and gene ontology pathways enriched in the intersection gene set. d, Motifs enriched in the intersection gene set from (c). e, Chromatin accessibility at ERRγ target genes determined by ATAC-Seq in insulin-expressing cells sorted from HILOs treated with PBS or WNT4 (wHILO) for 7 days (fold change>1.5). Error bars represent ± SEM. *p<0.05, one-tailed, student’s paired t test. Data representative of 3 (a, b) or 2 (c-e) independent experiments.
Extended Data Fig. 5. ERRγ is required for WNT4-driven metabolic maturation.
a-b, Postnatal islets (day P11–14) from WT and β cell specific ERRγKO mice were cultured with or without rhWNT4 (100ng/ml) for >5 days. Relative gene expression measured by qPCR (a), and insulin secretion in response to 3mM and 20mM glucose (b). n=3. Error bars represent ± SEM.*p<0.05, **p<0.01, ***p<0.001, one-tailed, student’s paired t test. Data representative of 2 independent experiments (a, b).
Extended Data Fig. 6. Immunofluorescence characterization of wHILOs.
a-c, Confocal images of wHILOs stained for C-peptide (a), β cell enriched markers NKX2–2, NKX6–1, MAFA, MAFB, PDX1 (b), and endocrine markers chromogranin A (CHGA), Synaptophysin (red) with Insulin-GFP (green) visualization (c). (d) Magnification of 75μm x75μm boxed regions shown in (b) and (c). (e) Immunofluorescence images of wHILOs showing insulin (GFP), β cell markers MAFA and MAFB, and α cell marker glucagon expression. Hoechst nuclei staining (blue). Scale bar: 100 μm panels a-c, 10μm panel e. Images are representative of 3 independent experiments.
Extended Data Fig. 7. Flow cytometry analysis of HILOs.
a, Representative flow cytometry results for β cell and endocrine marker co-staining in HILOs with and without WNT4 treatment. b, Quantification of results in a (n=6).
Extended Data Fig. 8. Single cell analysis of wHILOs.
a, tSNE clustering of single cell transcriptomes from WNT4-treated HILOs (wHILOs, n=4840). b, c, Violin Plots (b) and single cell expression (c) of INS, CHGA, SOX9, HES1 in wHILOs. d, Expression of β cell-enriched (INS, PDX1, NKX6–1, NKX2–2, NEUROD1, NPTX2, ITGA1, PCSK1, MAFA, MAFB, UCN3, CHGA), α cell-enriched (GCG, ARX) and δ cell-enriched genes (SST, RBP4) overlaid on tSNE clustering. e, Heatmap of top 10 differentially expressed genes in each cell cluster. f, tSNE clusters colored according to cell type (Panc P = pancreatic progenitor, Rep = replicating, UK = unknown) g, UMAP clustering of combined HILOs and wHILO single cell data sets after expression restoration of sparse counts using SAVER. h, Heatmap shows the differentially expressed genes (LogFC) between HILOs and wHILOs in ESRRG and INS double positive cells using WhichCells function (expression > 0.1). i, Distribution of ERRγ (ESRRG; min: 0.10, 0.50; 1stQ: 0.14, 1.15; mean: 0.54, 1.22; 3rdQ 0.90, 1.56; max: 1.60, 1.60 for HILOs and wHILOs respectively), NDUFV3 (min: −0.31, 1.21; 1stQ; −0.01, 1.33; mean: 0.49, 1.67; 3rdQ 1.00, 1.98; max: 2.22, 2.14 for HILOs and wHILOs respectively), LDHA (min: 0.05, 1.02; 1stQ; 0.50, 1.21; mean: 1.35, 1.33; 3rdQ 1.90, 1.44; max: 3.53, 1.67 for HILOs and wHILOs respectively) gene expression in ESRRG and INS double-positive HILOs (n=38) and wHILOs (n=9). Data pooled from three independent samples (a-i).
Extended Data Fig. 9. PD-L1 expression in HILOs.
a, Endogenous PD-L1 expression highlighted in red in human islet cells (n= 3245) (β cells are outlined in red). b, Heatmap of top differentially expressed genes between PD-L1+ and PD-L1- β cells. c, Immunohistochemistry showing overlap of lentiviral-driven PD-L1 expression and insulin promoter-driven GFP expression in wHILOs (scale bar, 100μm). d, Human PD-L1 and human insulin expression in wHILOs with and without lentiviral PD-L1 overexpression, as measured by qPCR (n=3). e, Transplantation of PD-L1 overexpressing wHILOs into the kidney capsule of STZ-induced diabetic mice. f, Blood glucose levels of C57BL6J mice treated with high dose streptozotocin (HD-STZ) prior to transplantation of wHILOs with and without PD-L1 overexpression (500 wHILOs into each kidney, total 1,000 wHILOs) (n=3) g, PD-L1 expression in human islet 12 hours after IFNγ stimulation (n=5). h, PD-L1 expression in wHILOs 12 hours after indicated IFNγ stimulation (n=3). Error bars represent ± SEM. *p<0.05, **p<0.01, ***p<0.001, one-tailed, student’s paired t test. Data were pooled from 3 independent samples (a) or representative of 3 independent experiments (c, d, g, h).
Extended Data Fig. 10. Immune profiling of C57BL6J wHILO grafts.
a, Flow cytometry analysis of insulin expressing and mouse immune (CD45+) cells recovered from kidney capsule grafts 27 days after transplantation of wHILOs with and without PD-L1 expression. CD45+ cells were further categorized as B cells (CD19+), T cells (CD3+) and NK cells (NK1.1+). b, Quantification of a, (n=6 and 6). c, wHILO (PD-L1) cells in kidney graft 27 days after transplantation (insulin promoter driven GFP expression). Scale bar, 100 μm. Error bars represent ± SEM. *p<0.05, one tailed, student’s paired t test. Data representative of 2 independent experiments.
Extended Data Fig. 11. IFNγ-induced changes in wHILOs.
a, Venn diagram of differentially regulated genes upon acute (12h at 10 ng/ml) and multi pulse stimulated (MPS; 2h at 10 ng/ml for 3 days) IFNγ treatment of wHILOs. b, Heatmap of differentially expressed genes upon acute and MPS IFNγ stimulation. Sustainable PD-L1 gene expression by MPS is indicated. c, Gene ontology of selectively regulated genes upon MPS-IFNγ (top panel) and acute IFNγ (bottom panel) treatments. d, Browser tracks showing chromatin accessibility at selected genes 7 days after last IFNγ treatment in MPS or 12 hours after acute IFNγ stimulation in wHILOs. Data were from triplicate (a-c) or duplicate (d) samples.
Extended Data Fig. 12. Immune evasive wHILOs by enhanced endogenous PD-L1 expression.
a, Schematic showing multi-low dose streptozotocin treatment (MLD-STZ, 50mg/kg/day for 5 days) of Hu-PBMC-NSG mice to make immune competent diabetic model. MPS induced PD-L1 expressing wHILOs (n=500) were transplanted under kidney capsule. b, Random fed blood glucose levels in STZ-induced diabetic Hu-PBMC-NSG mice after transplantation of wHILOs with or without MPS (n=6). Data for wHILOs (−) from Fig. 4c was used since those experiments were performed in parallel. c, Flow cytometry analyses of insulin-expressing and human immune (CD45+) cells recovered from kidney capsule grafts 27 days after transplantation of wHILOs with or without MPS. Error bars represent ± SEM. *p<0.05, **p<0.01, ***p<0.001, one-tailed, student’s paired t test. Data were compiled from (b) or representative of 2 independent experiments.
Supplementary Material
Supplementary Table 4.Information on primers, antibodies and plasmids
Supplementary Table 3. Differentially expressed genes between wHILOs and human islets Gene Ontology: Top 200 differentially expressed genes of Fig. 2b. P value unadjusted (p_val) and adjusted (p_val_adj) for differentially expressed genes and p value (p value) and Benjamini correction (Benjamini) for Gene Ontology (GO) analysis were determined by default setting of Seurat40 and DAVID42, respectively.
Supplementary Table 1. Differentially expressed genes during hADSC self organization Gene Ontology: Top Features in each gene cluster of Extended Data Fig. 2c. P values for Gene Ontology (GO) analysis determined by default setting of DAVID42.
Supplementary Table 2. Summary of droplet-based scRNA-seq results
Supplementary Table 5. Violin plot elements
Acknowledgements
We thank J. Norris, H. Song, B. Henriquez, B. Collins, and H. Juguilon for technical assistance, and L. Ong and C. Brondos for administrative assistance. We thank Drs. M. Ahmadian and S. Liu for sharing materials and helpful discussion. scRNA-seq and ATAC-seq were supported by Next Generation Sequencing Core (Nasun Hah) of the Salk Institute and the UCSD IGM Genomics Center (Kristen Jepsen). Cell sorting and flow cytometry analyses, TEM, and stem cell cultures were supported by the Flow Cytometry Core, the Waitt Advanced Biophotonics Core, and the Stem Cell Core facilities at the Salk Institute, with funding from NIH-NCI CCSG: P30 014195 and the Waitt Foundation. R.M.E. is an investigator of the Howard Hughes Medical Institute at the Salk Institute and March of Dimes Chair in Molecular and Developmental Biology. This work is supported by grants from CIRM (DISC2–11175), NIH (1RO1DK120480–01), the Glenn Foundation for Medical Research, the Leona M. and Harry B. Helmsley Charitable Trust (2017-PG-MED001), Ipsen/Biomeasure, and by a gift from Steven and Lisa Altman. C.L. and M.D. are funded by grants from the National Health and Medical Research Council of Australia Project (512354, 632886, and 1043199). E.Y. is supported by DRC P&F grant (P30 DK063491).
Footnotes
The authors declare no competing financial interests.
Data availability
RNA-Seq and ATAC-Seq data that support the findings of this study have been deposited in the National Center for Biotechnology Information (NCBI) Sequence Read Archive (SRA) database, Accession # PRJNA505532 (https://www.ncbi.nlm.nih.gov/bioproject/PRJNA505532).
References
- 1.Yoshihara E. et al. ERRgamma Is Required for the Metabolic Maturation of Therapeutically Functional Glucose-Responsive beta Cells. Cell metabolism 23, 622–634, doi: 10.1016/j.cmet.2016.03.005 (2016). [DOI] [PMC free article] [PubMed] [Google Scholar]
- 2.Hrvatin S. et al. Differentiated human stem cells resemble fetal, not adult, beta cells. Proceedings of the National Academy of Sciences of the United States of America 111, 3038–3043, doi: 10.1073/pnas.1400709111 (2014). [DOI] [PMC free article] [PubMed] [Google Scholar]
- 3.Rezania A. et al. Reversal of diabetes with insulin-producing cells derived in vitro from human pluripotent stem cells. Nature biotechnology 32, 1121–1133, doi: 10.1038/nbt.3033 (2014). [DOI] [PubMed] [Google Scholar]
- 4.Pagliuca FW et al. Generation of functional human pancreatic beta cells in vitro. Cell 159, 428–439, doi: 10.1016/j.cell.2014.09.040 (2014). [DOI] [PMC free article] [PubMed] [Google Scholar]
- 5.Kieffer TJ Closing in on Mass Production of Mature Human Beta Cells. Cell stem cell 18, 699–702, doi: 10.1016/j.stem.2016.05.014 (2016). [DOI] [PubMed] [Google Scholar]
- 6.Liu JS & Hebrok M. All mixed up: defining roles for beta-cell subtypes in mature islets. Genes & development 31, 228–240, doi: 10.1101/gad.294389.116 (2017). [DOI] [PMC free article] [PubMed] [Google Scholar]
- 7.Takebe T. et al. Vascularized and functional human liver from an iPSC-derived organ bud transplant. Nature 499, 481–484, doi: 10.1038/nature12271 (2013). [DOI] [PubMed] [Google Scholar]
- 8.Asai A. et al. Paracrine signals regulate human liver organoid maturation from induced pluripotent stem cells. Development 144, 1056–1064, doi: 10.1242/dev.142794 (2017). [DOI] [PMC free article] [PubMed] [Google Scholar]
- 9.Bader E. et al. Identification of proliferative and mature beta-cells in the islets of Langerhans. Nature 535, 430–434, doi: 10.1038/nature18624 (2016). [DOI] [PubMed] [Google Scholar]
- 10.van der Meulen T. et al. Urocortin3 mediates somatostatin-dependent negative feedback control of insulin secretion. Nature medicine 21, 769–776, doi: 10.1038/nm.3872 (2015). [DOI] [PMC free article] [PubMed] [Google Scholar]
- 11.Blum B. et al. Functional beta-cell maturation is marked by an increased glucose threshold and by expression of urocortin 3. Nature biotechnology 30, 261–264, doi: 10.1038/nbt.2141 (2012). [DOI] [PMC free article] [PubMed] [Google Scholar]
- 12.van der Meulen T. et al. Urocortin 3 marks mature human primary and embryonic stem cell-derived pancreatic alpha and beta cells. PloS one 7, e52181, doi: 10.1371/journal.pone.0052181 (2012). [DOI] [PMC free article] [PubMed] [Google Scholar]
- 13.Prentki M, Matschinsky FM & Madiraju SR Metabolic signaling in fuel-induced insulin secretion. Cell metabolism 18, 162–185, doi: 10.1016/j.cmet.2013.05.018 (2013). [DOI] [PubMed] [Google Scholar]
- 14.Huang SM et al. Tankyrase inhibition stabilizes axin and antagonizes Wnt signalling. Nature 461, 614–620, doi: 10.1038/nature08356 (2009). [DOI] [PubMed] [Google Scholar]
- 15.Baas M. et al. TGFbeta-dependent expression of PD-1 and PD-L1 controls CD8(+) T cell anergy in transplant tolerance. eLife 5, e08133, doi: 10.7554/eLife.08133 (2016). [DOI] [PMC free article] [PubMed] [Google Scholar]
- 16.Martinov T, Spanier JA, Pauken KE & Fife BT PD-1 pathway-mediated regulation of islet-specific CD4+ T cell subsets in autoimmune diabetes. Immunoendocrinology 3, doi: 10.14800/ie.1164 (2016). [DOI] [PMC free article] [PubMed] [Google Scholar]
- 17.Keir ME et al. Tissue expression of PD-L1 mediates peripheral T cell tolerance. J Exp Med 203, 883–895, doi: 10.1084/jem.20051776 (2006). [DOI] [PMC free article] [PubMed] [Google Scholar]
- 18.Ansari MJ et al. The programmed death-1 (PD-1) pathway regulates autoimmune diabetes in nonobese diabetic (NOD) mice. The Journal of experimental medicine 198, 63–69, doi: 10.1084/jem.20022125 (2003). [DOI] [PMC free article] [PubMed] [Google Scholar]
- 19.Ma D. et al. PD-L1 Deficiency within Islets Reduces Allograft Survival in Mice. PloS one 11, e0152087, doi: 10.1371/journal.pone.0152087 (2016). [DOI] [PMC free article] [PubMed] [Google Scholar]
- 20.Rui J. et al. beta Cells that Resist Immunological Attack Develop during Progression of Autoimmune Diabetes in NOD Mice. Cell metabolism 25, 727–738, doi: 10.1016/j.cmet.2017.01.005 (2017). [DOI] [PMC free article] [PubMed] [Google Scholar]
- 21.Wang CJ et al. Protective role of programmed death 1 ligand 1 (PD-L1)in nonobese diabetic mice: the paradox in transgenic models. Diabetes 57, 1861–1869, doi: 10.2337/db07-1260 (2008). [DOI] [PMC free article] [PubMed] [Google Scholar]
- 22.Colli ML et al. PDL1 is expressed in the islets of people with type 1 diabetes and is up-regulated by interferons-alpha and-gamma via IRF1 induction. EBioMedicine 36, 367–375, doi: 10.1016/j.ebiom.2018.09.040 (2018). [DOI] [PMC free article] [PubMed] [Google Scholar]
- 23.Osum KC et al. Interferon-gamma drives programmed death-ligand 1 expression on islet beta cells to limit T cell function during autoimmune diabetes. Sci Rep 8, 8295, doi: 10.1038/s41598-018-26471-9 (2018). [DOI] [PMC free article] [PubMed] [Google Scholar]
- 24.Eizirik DL & Mandrup-Poulsen T. A choice of death--the signal-transduction of immune-mediated beta-cell apoptosis. Diabetologia 44, 2115–2133, doi: 10.1007/s001250100021 (2001). [DOI] [PubMed] [Google Scholar]
- 25.Russ HA et al. Controlled induction of human pancreatic progenitors produces functional beta-like cells in vitro. The EMBO journal 34, 1759–1772, doi: 10.15252/embj.201591058 (2015). [DOI] [PMC free article] [PubMed] [Google Scholar]
- 26.Nair GG et al. Recapitulating endocrine cell clustering in culture promotes maturation of human stem-cell-derived beta cells. Nat Cell Biol 21, 263–274, doi: 10.1038/s41556-018-0271-4 (2019). [DOI] [PMC free article] [PubMed] [Google Scholar]
- 27.Sneddon JB et al. Stem Cell Therapies for Treating Diabetes: Progress and Remaining Challenges. Cell stem cell 22, 810–823, doi: 10.1016/j.stem.2018.05.016 (2018). [DOI] [PMC free article] [PubMed] [Google Scholar]
- 28.Zhou Q. & Melton DA Pancreas regeneration. Nature 557, 351–358, doi: 10.1038/s41586-018-0088-0 (2018). [DOI] [PMC free article] [PubMed] [Google Scholar]
- 29.Turner M. et al. Toward the development of a global induced pluripotent stem cell library. Cell stem cell 13, 382–384, doi: 10.1016/j.stem.2013.08.003 (2013). [DOI] [PubMed] [Google Scholar]
- 30.Morizane A. et al. MHC matching improves engraftment of iPSC-derived neurons in non-human primates. Nature communications 8, 385, doi: 10.1038/s41467-017-00926-5 (2017). [DOI] [PMC free article] [PubMed] [Google Scholar]
- 31.Wei Z. et al. Vitamin D Switches BAF Complexes to Protect beta Cells. Cell 173, 1135–1149 e1115, doi: 10.1016/j.cell.2018.04.013 (2018). [DOI] [PMC free article] [PubMed] [Google Scholar]
- 32.Yoshihara E. et al. Disruption of TBP-2 ameliorates insulin sensitivity and secretion without affecting obesity. Nature communications 1, 127, doi: 10.1038/ncomms1127 (2010). [DOI] [PMC free article] [PubMed] [Google Scholar]
- 33.Buenrostro JD, Wu B, Chang HY & Greenleaf WJ ATAC-seq: A Method for Assaying Chromatin Accessibility Genome-Wide. Current protocols in molecular biology 109, 21 29 21–29, doi: 10.1002/0471142727.mb2129s109 (2015). [DOI] [PMC free article] [PubMed] [Google Scholar]
- 34.Heinz S. et al. Simple combinations of lineage-determining transcription factors prime cis-regulatory elements required for macrophage and B cell identities. Mol Cell 38, 576–589, doi: 10.1016/j.molcel.2010.05.004 (2010). [DOI] [PMC free article] [PubMed] [Google Scholar]
- 35.Dobin A. et al. STAR: ultrafast universal RNA-seq aligner. Bioinformatics 29, 15–21, doi: 10.1093/bioinformatics/bts635 (2013). [DOI] [PMC free article] [PubMed] [Google Scholar]
- 36.Trapnell C. et al. Differential analysis of gene regulation at transcript resolution with RNA-seq. Nature biotechnology 31, 46–53, doi: 10.1038/nbt.2450 (2013). [DOI] [PMC free article] [PubMed] [Google Scholar]
- 37.Roberts A, Pimentel H, Trapnell C. & Pachter L. Identification of novel transcripts in annotated genomes using RNA-Seq. Bioinformatics 27, 2325–2329, doi: 10.1093/bioinformatics/btr355 (2011). [DOI] [PubMed] [Google Scholar]
- 38.van Dijk D. et al. Recovering Gene Interactions from Single-Cell Data Using Data Diffusion. Cell 174, 716–729 e727, doi: 10.1016/j.cell.2018.05.061 (2018). [DOI] [PMC free article] [PubMed] [Google Scholar]
- 39.Macosko EZ et al. Highly Parallel Genome-wide Expression Profiling of Individual Cells Using Nanoliter Droplets. Cell 161, 1202–1214, doi: 10.1016/j.cell.2015.05.002 (2015). [DOI] [PMC free article] [PubMed] [Google Scholar]
- 40.Butler A, Hoffman P, Smibert P, Papalexi E. & Satija R. Integrating single-cell transcriptomic data across different conditions, technologies, and species. Nature biotechnology 36, 411–420, doi: 10.1038/nbt.4096 (2018). [DOI] [PMC free article] [PubMed] [Google Scholar]
- 41.Trapnell C. et al. The dynamics and regulators of cell fate decisions are revealed by pseudotemporal ordering of single cells. Nature biotechnology 32, 381–386, doi: 10.1038/nbt.2859 (2014). [DOI] [PMC free article] [PubMed] [Google Scholar]
- 42.Huang da W. et al. Extracting biological meaning from large gene lists with DAVID. Curr Protoc Bioinformatics Chapter 13, Unit 13 11, doi: 10.1002/0471250953.bi1311s27 (2009). [DOI] [PubMed] [Google Scholar]
- 43.Walter W, Sanchez-Cabo F. & Ricote M. GOplot: an R package for visually combining expression data with functional analysis. Bioinformatics 31, 2912–2914, doi: 10.1093/bioinformatics/btv300 (2015). [DOI] [PubMed] [Google Scholar]
Associated Data
This section collects any data citations, data availability statements, or supplementary materials included in this article.
Supplementary Materials
Supplementary Table 4.Information on primers, antibodies and plasmids
Supplementary Table 3. Differentially expressed genes between wHILOs and human islets Gene Ontology: Top 200 differentially expressed genes of Fig. 2b. P value unadjusted (p_val) and adjusted (p_val_adj) for differentially expressed genes and p value (p value) and Benjamini correction (Benjamini) for Gene Ontology (GO) analysis were determined by default setting of Seurat40 and DAVID42, respectively.
Supplementary Table 1. Differentially expressed genes during hADSC self organization Gene Ontology: Top Features in each gene cluster of Extended Data Fig. 2c. P values for Gene Ontology (GO) analysis determined by default setting of DAVID42.
Supplementary Table 2. Summary of droplet-based scRNA-seq results
Supplementary Table 5. Violin plot elements


