Tuberculosis (TB) is the leading worldwide cause of death by an infectious disease1. The involvement of innate lymphoid cells (ILC) in immune responses to Mycobacterium tuberculosis (Mtb) infection is unknown. We show that circulating ILC subsets are depleted from the blood of pulmonary TB (PTB) participants and restored upon treatment. TB increased accumulation of ILC subsets in the human lung, coinciding with a robust transcriptional response to infection, including a role in orchestrating the recruitment of immune subsets. Using mouse models, we show that Group 3 ILCs (ILC3) accumulated rapidly in Mtb-infected lungs and coincided with alveolar macrophage accumulation. Importantly, mice lacking ILC3s exhibit reduced early alveolar macrophage accumulation and decreased Mtb control. The C-X-C Motif Chemokine Receptor 5 (CXCR5)/ C-X-C Motif Chemokine Ligand 13 (CXCL13) axis is implicated in Mtb control, as infection upregulated CXCR5 on circulating ILC3s and increased plasma levels of its ligand CXCL13 in humans. Moreover, Interleukin (IL)-23-dependent ILC3 expansion in mice and production of IL-17 and IL-22 were found to be critical inducers of lung CXCL13, early innate immunity, and formation of protective lymphoid follicles within granulomas. Thus, we demonstrate a previously undescribed early protective role for ILC3s in immunity to Mtb infection.
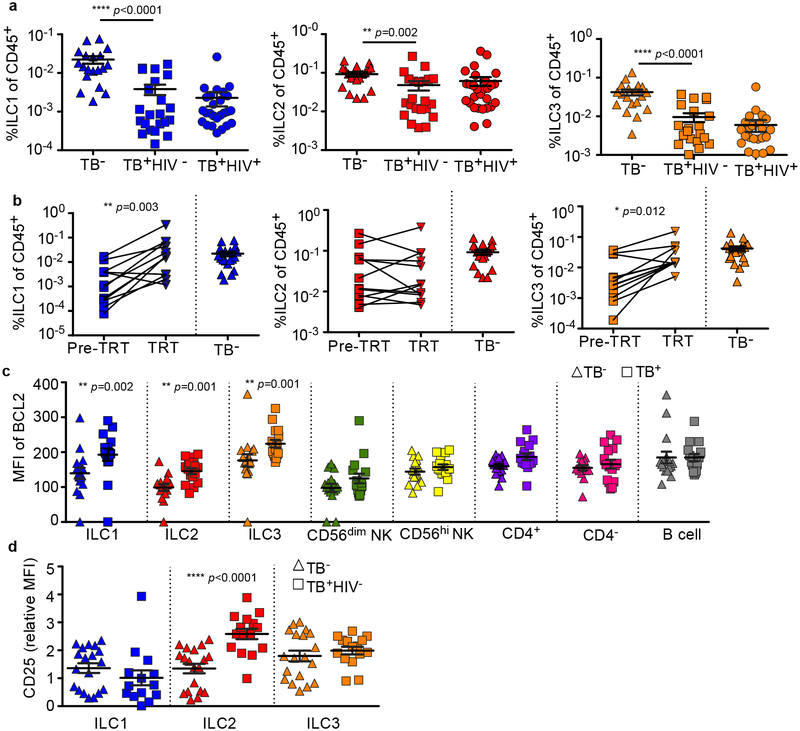
ILCs share features with both adaptive and innate immune cells and comprise of three main subsets2,3. Type 1 ILCs produce interferon (IFN)-γ and include natural killer (NK) cells and non-cytotoxic, non-NK type 1 ILCs2,3. Group 2 ILCs, which produce IL-4, IL-5 and IL-13, are involved in inflammatory-linked airway hyperactivity, tissue repair and helminth clearance2,3. ILC3s produce IL-17 and/or IL-224, and can participate in the strategic positioning of immune cells in ectopic lymphoid structures5. Circulating ILC3s are enriched for uni- and multi-potent ILC precursors, and can give rise to all known ILC subsets, including NK cells in vivo6. ILCs are crucial for lung tissue repair following infection7, and in generating hepatic granulomas8. Thus, we investigated the role of ILCs in the immune responses to TB. Using a validated flow cytometry panel (Extended Data Fig. 1), we found blood ILCs were highly depleted in TB-infected participants compared to control participants, including the CD117+ ILC3 subset (Fig. 1a), but not NK cells (Extended Data Fig. 2a). ILC depletion was not exacerbated by drug resistance or HIV-coinfection (Fig. 1a; Extended Data Fig. 2b). Using paired samples from HIV− participants, we found that ILC1s and ILC3s rebounded after treatment, but ILC2s remained depleted (Fig. 1b). Thus, in contrast to persistent HIV infection9, circulating ILC1s and ILC3s were restored once Mtb infection was cleared, confirming a role for bacteraemia in modulating ILC accumulation. Whether ILC2s recover at a later time-point remains to be tested. Depletion of blood ILCs during acute HIV is associated with cell death9. However, TB infection was not associated with significant changes to caspase-3 expression in ILCs (Extended Data Fig. 2c), but with an increase in the anti-apoptotic marker B-cell lymphoma 2 (BCL2) (Fig. 1c). In addition, ILC2s showed a significant upregulation of CD25 (Fig. 1d), a marker of activation and pro-survival phenotype in T cells10. These data suggest that circulating ILCs respond to Mtb infection but are not lost from the blood due to cell death.
Figure 1. Circulating ILCs are depleted and activated in response to TB.
(a) Circulating ILC subsets were enumerated in blood of HIV+ and HIV− TB participants, and healthy controls by flow cytometry. Significance by Kruskal-Wallis test with corrections for multiple comparisons. (b) Paired ILC subsets in the blood before and after standard TB treatment were compared to frequencies in healthy controls (p-value by Wilcoxon matched-pairs test). Pre-TRT = untreated; TRT = after treatment. (c) The median fluorescent intensity (MFI) of the anti-apoptotic marker BCL2 was measured in TB+ and control participants on all ILC subsets, and in CD56hi NK cells, but not CD56dim NKs, CD4+, CD4−CD3+ T cells and CD19-expressing B cells. Significance by unpaired Mann-Whitney U test with Bonferroni corrections. (d) Expression of activation and pro-survival marker CD25 was determined using flow cytometry in ILC subsets in blood from HIV+ and HIV− TB participants. Significance by Kruskal-Wallis test with corrections for multiple comparisons.
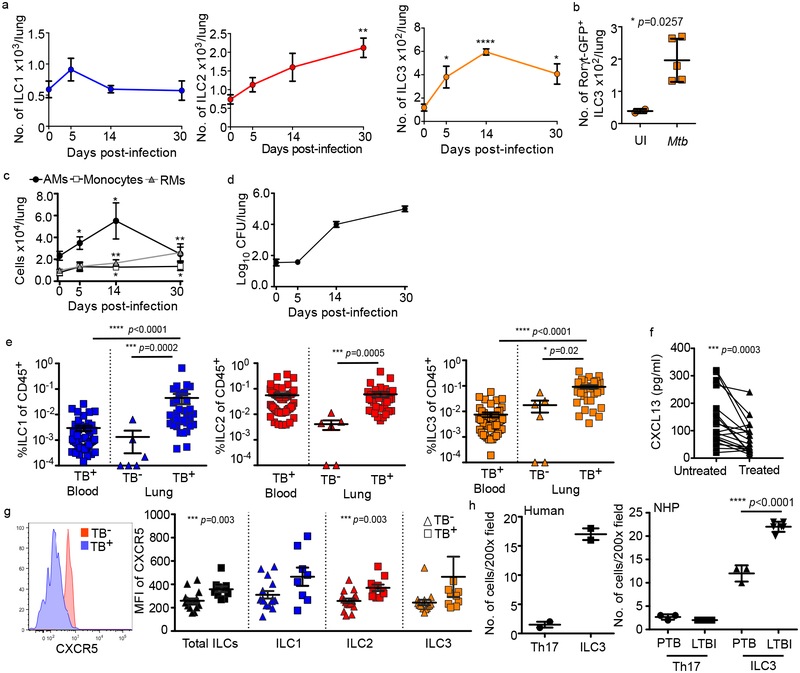
We next asked if ILCs accumulate in the lungs following Mtb infection using a mouse model. C57BL/6 (B6) mice infected with aerosolized Mtb showed rapid early accumulation of ILC3s, but not ILC1s, with later accumulation of ILC2 (Fig. 2a, Extended Data Fig. 3), and ILC3s increased as infection proceeded (Fig. 2a). Simililarly, a B6. RAR-related orphan receptor gamma-t (Rorγt)-GFP expressing ILC3 subset also accumulated during Mtb infection (Fig. 2b). Importantly, accumulation of ILC3s coincided with alveolar macrophage (AM) accumulation, and preceded the accumulation of monocytes and recruited macrophages (Fig. 2c) and Mtb control in the lung (Fig. 2d). To confirm these observations in humans, we next examined fresh lung tissue, surgically resected from TB-infected participants, and identified tissue resident ILCs using established markers (Extended Data Figs. 1 and 4a). Here, and in contrast to blood, all ILC subsets, including NKp44+ and NKp44− ILC3 subpopulations, but not NK cells, were increased compared to healthy lung tissue margins from non-TB lung controls (Fig. 2e; Extended Data Figs. 4b and 4c). Notably, this was not affected by HIV co-infection (Extended Data Fig. 4d). Together, our results show that while circulating ILCs are reduced during PTB, they are rapidly increased upon infection in mice and accumulate in the lungs of both mice and human Mtb-infected participants.
Figure 2. ILCs rapidly accumulate within lung tissues and are associated with lymphoid follicle containing granulomas.
(a-c) C57BL/6 (B6, n=5) mice or Rorγt-GFP (n=3–5) mice were aerosol infected with ~100 CFU Mtb. (a) Numbers of ILC1s, ILC2s, ILC3s in B6 mice and (b) number of ILC3s in Rorγt-GFP mice were quantified by flow cytometric analyses. (c) Numbers of AMs, monocytes, and recruited macrophages (RMs) were measured and quantified by flow cytometric analyses in B6 mice (n=5). (d) Bacterial burden was measured in the lungs of B6 mice by plating (n=5). Data shown as mean ± SEM (a) or mean ± SD (b-d). Where p-value not shown, *p<0.05, **p<0.01, ****p<0.0001. Significance by Student’s t-test (a-c). (e) Human ILC subsets were measured in TB infected lung tissue (TB+) compared to TB− control lung tissue, and in the circulation using flow cytometry. Significance by Kruskal-Wallis test with adjustments for multiple comparisons was carried out. (f) CXCL13 protein levels were measured in plasma from drug-susceptible TB subjects, and after 6 months of standard TB treatment (two-tailed Wilcoxon matched-pairs test). (g) CXCR5 expression was measured on circulating ILC subsets using flow cytometry. Significance by Mann-Whitney U test with correction for multiple comparisons; only significant p-values after correction shown. (h) ILC3 quantification in the FFPE lung sections from human, non-human primates (LTBI and PTB) was carried out by staining with CD3, B220 and RORγt and the number of RORγt+CD3− (ILC3) and RORγt+CD3+ (Th17) cells were counted and shown. Data shown as mean ± SD. Significance by Student’s t-test (h).
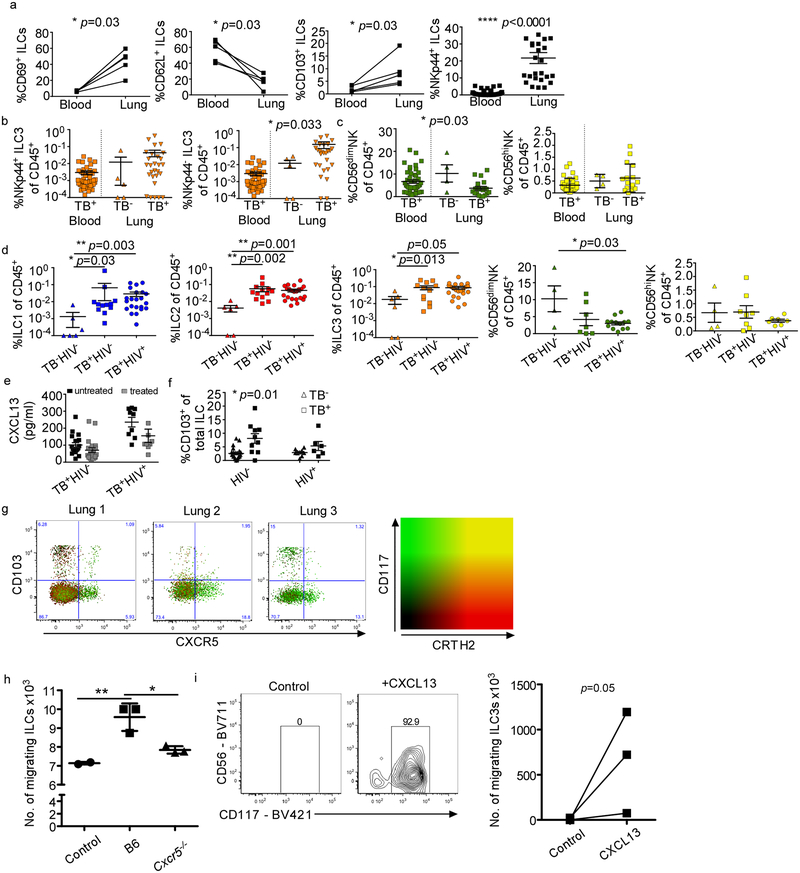
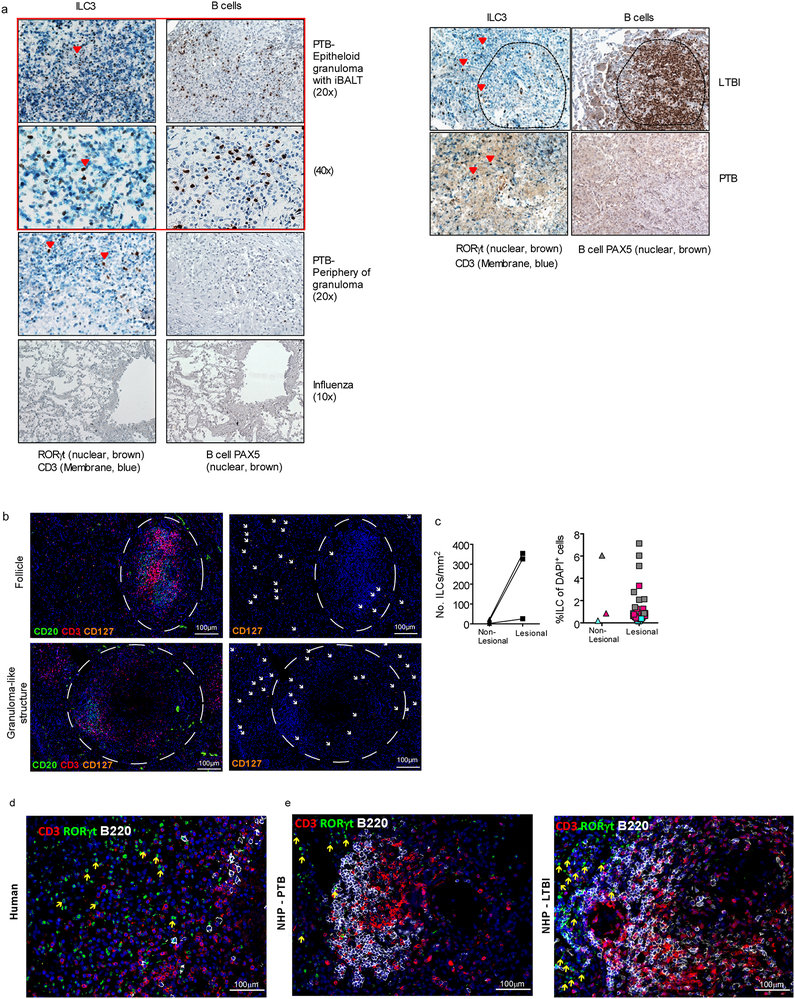
The chemokine CXCL13 is induced in murine and human lungs during TB infection11, and recruits lymphocytes via CXCR5 to mediate their spatial organization within lymphoid structures called inducible Bronchus associated lymphoid structures (iBALT)11. Consistent with this, high levels of CXCL13 were detected in the plasma of participants with PTB, that reduced following TB treatment (Fig. 2f), irrespective of HIV co-infection (Extended Data Fig. 4e). Furthermore, CXCR5 expression on all human blood ILC subsets was increased (Fig. 2g), as well as CD103 (Extended Data Fig. 4f), a tissue-resident lymphocyte marker. Subsequently, we detected distinct populations of CXCR5-expressing ILC3s, and CD103-expressing ILC2 and ILC3s in human TB lung tissue (Extended Data Fig. 4g). Importantly, mouse and human ILCs migrated in response to CXCL13, in a CXCR5-dependent manner in mouse ILC3s (Extended Data Fig. 4h,i). Given the role of CXCR5 in iBALT formation, we hypothesized that ILC3s would localize within iBALT-containing TB lung granulomas. In histological sections from human PTB participants we confirmed the enrichment of CD3−RORγt+ and CD3−CD127+ ILC3s but not CD3+RORγt+ (Th17 cells) within granuloma associated lymphoid follicles compared to the low numbers of CD3−RORγt+ ILC3s in necrotic TB granulomas and non-TB influenza infected lung tissue (Fig. 2h and Extended Data Fig. 5a–d). To examine ILC3 localization during TB latency (LTBI), we turned to the non-human primate (NHP) macaque model of Mtb infection11, where CD3−RORγt+ ILC3s localized significantly within the non-necrotic well-formed iBALT containing TB granulomas of macaques with LTBI, but not within necrotic granulomas in macaques with PTB (Fig. 2h and Extended Data Fig. 5e). These data together show that the CXCL13/CXCR5 axis is involved in functional recruitment of lung ILC3s following Mtb infection, and in the localisation of ILC3s to iBALT associated granulomas.
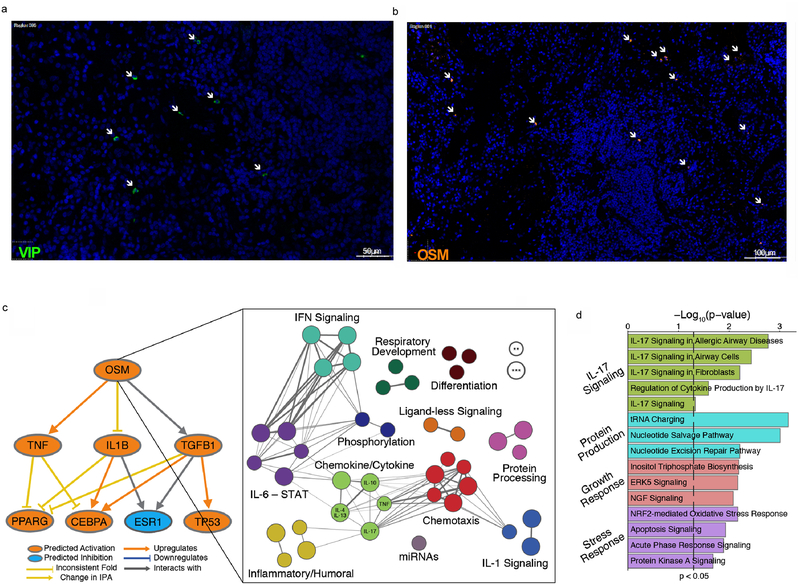
Next, to characterize human Iung ILCs, we performed RNA-sequencing on ILC2s and ILC3s sorted from fresh resected lungs of TB-infected participants and two controls (sorted based on Extended Data Fig. 1; sort purity shown in Extended Data Fig. 6). Differential expression (DE) analysis of ILC2s (45 significant DE genes), highlighted ILC2 genes indicative of inflammatory signalling (IL13, IL1RL1), tissue repair (Amphiregulin, AREG) (Fig. 3a, Supplementary Table 1), and Zinc Finger and BTB Domain Containing 16 (ZBTB16), which is expressed during ILC development12. Notably, ILC2s expressed KIT, usually associated with ILC3s, but previously demonstrated in a subset of ILC2s13. ILC3s significantly upregulated 1438 genes (Fig. 3a, Supplementary Table 2), including RORc and Natural Cytotoxic Receptor 3 (NCR3), and genes encoding pro-inflammatory cytokines (IL1B, Colony stimulating factor (CSF)-3 and Oncostatin M (OSM)) associated with pulmonary TB and innate cell recruitment14,15. Accordingly, 7 chemokine genes, including CXCL1 and CXCL5, central to neutrophil recruitment in pulmonary TB16, and the monocyte chemo-attractants CXCL17 and CCL2 (MCP-1), were all upregulated (Fig. 3b). Next, we identified potential upstream regulators of these responses by pathway analysis (Fig. 3c; Supplementary Tables 3, 4). The predicted top upstream drivers of the transcriptional profile observed in sorted ILC2 cells were IL17, IL6, CSF-1 and C-type lectin domain family 7 member A (CLEC7A), pathways implicated in PTB17–19, and Vasoactive Intestinal Peptide (VIP), that is known to be elevated during lung inflammation and interacts with the ILC2 marker Chemoattractant Receptor Homologous Molecule Expressed On T Helper Type 2 (CRTH2)20. As VIP had not been directly linked to TB, we confirmed protein expression in TB-infected human lung tissue (Extended Data Fig. 7a). Top predicted upstream drivers of ILC3 responses are IFNγ, IL1B, Peroxisome proliferator-activated receptor (PPAR)-γ and Hepatocyte Nuclear Factor (HNF) 4, all previously characterized in the TB immune response21,22, and OSM. The latter is less well studied in TB infection but, is detected in human granuolma23, and can be seen in lung tissue sections examined in this study (Extended Data Fig. 7b). Construction of gene interaction networks between our DE genes, and other published gene interactions, suggest that OSM may be linked to other major inflammatory cytokines, and inducers of cell growth and proliferation (Extended Data Fig. 7c, Supplementary Table 5). Moreover, genes downstream of OSM encompassed key immune response pathways, including IFN-signaling, IL-6/STAT, and chemotaxis. Lastly, looking across all DE genes in ILC3s for enriched pathways describing ILC3 responses (Extended Data Fig. 7d, Supplementary Table 6), highlights IL-17 signaling. Taken together these first transcriptional data from human TB-infected lung ILCs, show a clear response to infection, and in particular support a role of ILC3s in coordinating lung immunity.
Figure 3. ILCs demonstrate a structured response to PTB at the transcriptomic level.
(a) Lung ILC2s and ILC3s were sorted and differential gene expression between TB infected (n=5) and uninfected control tissue (n=2) were determined by RNA sequencing. (b) Expression of key chemokines and chemoattractant proteins significantly upregulated in pulmonary ILCs from TB participants (Pos, n=5) when compared to uninfected control lungs is shown (Neg, n=2). p-values corrected using Benjamini-Hochberg with a significance cut-off of FDR < 0.01. (c) Upstream drivers of differentially expressed genes in ILC2s and ILC3s were predicted using Ingenuity Pathway Analysis (IPA). p-values calculated by hypergeometric test between genes in our data and known interactions in the literature for each driver.
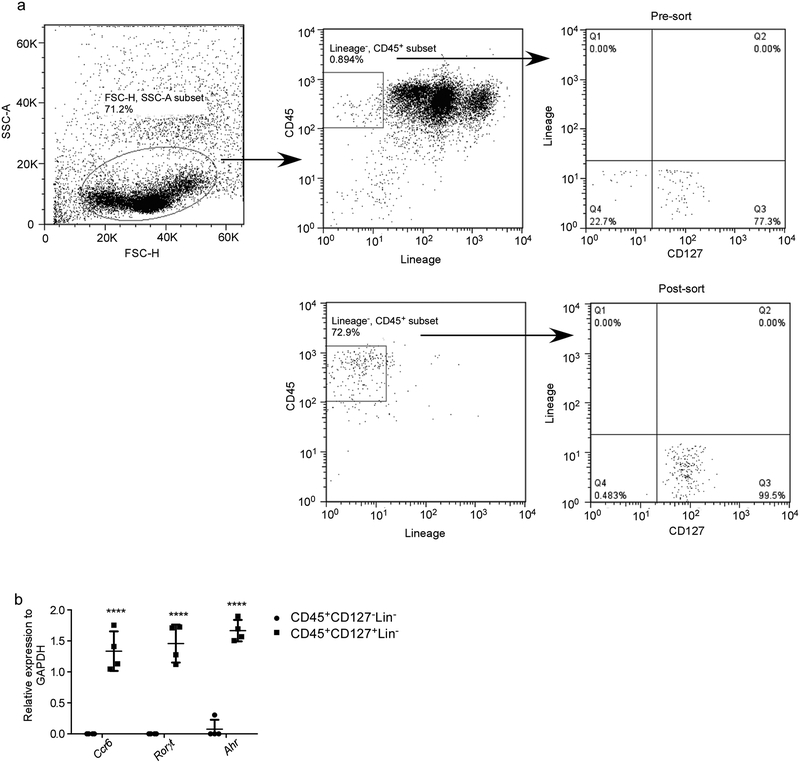
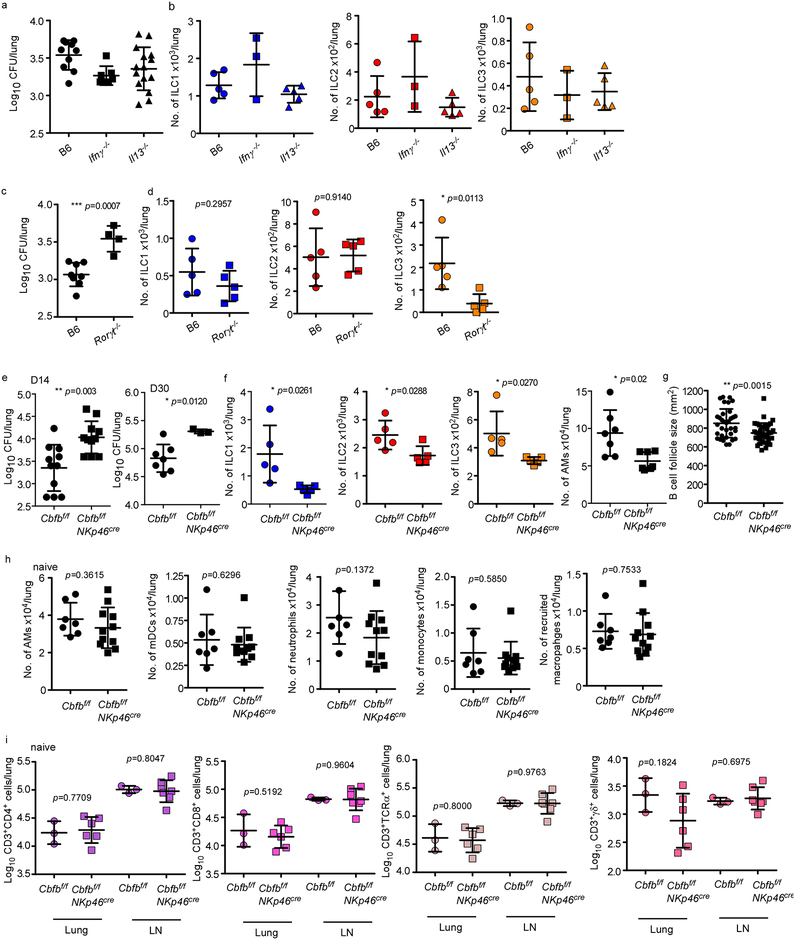
To address the mechanistic role of ILCs during Mtb infection, control mice, Rag1−/− and Rag2 common gamma chain double knockout (Rag2γc−/−) mice were aerosol infected with Mtb and early immune control was determined before accumulation of adaptive T cell responses occurred24. While Rag1−/− mice maintained early innate Mtb control similar to wild type mice at 14 days post infection (dpi), Rag2γc−/− mice exhibited increased Mtb CFU, and this coincided with absence of all lung ILC subsets (Fig. 4a,b). Importantly, increased early Mtb CFU in Rag2γc−/− could be rescued by adoptive transfer of sorted lung ILCs from Mtb-infected control mice which expressed Ccr6, Rorγt and Ahr (Fig. 4a, Extended Data Fig. 8a,b). These results suggest that innate responses in Rag1−/− mice are sufficient to mediate early Mtb control provided that common-γ chain-dependent ILCs are present. Furthermore, while Ifnγ−/− and Il13−/− mice maintained Mtb control at 14 dpi (Extended Data Fig. 9a), no changes in any ILCs subsets were observed (Extended Data Fig. 9b). In contrast, Rorγt−/− mice exhibited increased early Mtb lung burden (Extended Data Fig. 9c), and this coincided with decreased ILC3 accumulation, without impacting ILC1 and ILC2 subsets (Extended Data Fig. 9d). These results were further confirmed using mice with specific deletion of ILC3s, namely Ahrf/fRorγtCre mice, which exhibited increased early and late Mtb burden, decreased ILC3 and NKp46+ ILC3 accumulation and decreased AMs in the lung, when compared to Ahrf/f Mtb-infected mice (Fig. 4e,f). ILC1s and ILC2s accumulation were comparable between Ahrf/fRorγtCre and Ahrf/f Mtb-infected mice (Fig. 4f). This was corroborated in Core-Binding Factor Beta Subunit (Cbfb)f/fNKp46Cre mice, in which NKp46+ cells, including ILC1s, ILC3s and NK cells, are specifically depleted25, and in whom Mtb infection led to drastically reduced lung ILC subset accumulation when compared with Mtb-infected Cbfbf/f mice and this coincided with reduced AM accumulation and resulted in increased early and late susceptibility to Mtb infection (Extended Data Fig. 9e,f). Complete depletion of NK cells (Extended Data Fig. 10a) did not impact Mtb control (Extended Data Fig. 10b). Additionally, baseline characterization of myeloid and lymphocytic populations in lungs of Cbfbf/fNKp46Cre and Ahrf/fRorγtCre mice were comparable (Extended Data Fig. 9h,I and 10c,d). Lung ILC3s produce IL-17 and IL-22 in response to IL-23 stimulation2,26. Murine lung cells infected with Mtb produced IL-23 (Extended Data Fig. 10e). Moreover, Mtb-infected lung cells produced IL-22 and IL-17 when treated with recombinant IL-23 and IL-1β (Extended Data Fig. 10f). Furthermore, Il17/Il22−/− mice displayed a significant early increase in lung Mtb burden (Fig. 4g), decreased number of lung ILC3s as well as CXCR5+ ILC3s, but not ILC1 or ILC2s, and decreased expression of Cxcl13 mRNA within the granulomas (Fig. 4h,i). Accordingly, in vivo early neutralization of IL-23 in B6 mice resulted in increased early Mtb burden (Fig. 4j) and reduced accumulation of early lung ILC3s (Fig. 4k), when compared with isotype control treated B6 mice (Fig. 4j). Importantly, these early innate changes resulted in decreased formation of iBALT structures in all models (Ahrf/fRorγtCre, Cbfbf/fNKp46Cre, Il17/Il22−/− and IL-23 depleted Mtb-infected mice), when compared with their respective controls (Fig. 4l and Extended Data Fig. 9g). Similarly, Cxcr5−/− mice also exhibited increased lung Mtb CFU and decreased accumulation of ILC3s within lymphoid follicles, as well as decreased formation of iBALT structures (Extended Data Fig. 10g–i). Taken together, these data support an unexpected protective role for ILC3s in regulating early Mtb control through the production of IL-17 and IL-22 and formation of iBALT structures in a CXCR5-dependent manner.
Figure 4. ILCs mediate iBALT formation and contribute to early protection from Mtb.
Rag1−/−, Rag2γc−/− and wild type mice were aerosol infected with ~100 CFU Mtb. ILCs (CD45+CD127+Lin−NK1.1−) were isolated from Mtb infected wild type mice and ~5X10³ cells were intratracheally transferred into Rag2γc−/− mice 1 day before infection. (a) Lung bacterial burden at 14 dpi was determined by plating (n=5/group). (b) Number of ILC1s, ILC2s, total ILC3s and NKp46+ ILC3s and (c) AMs were measured by flow cytometry. (d) ILC3 quantification in histological lung sections was carried out by staining with CD3, B220 and Rorγt and the number of Rorγt+CD3− ILC3s were counted and shown. (e) Ahrf/f, Ahrf/fRorγtCre mice were aerosol infected with ~100 CFU Mtb and lung bacterial burden at 14 and 30 dpi was determined by plating (n=7–10/group). (f) Number of ILC1s, ILC2s, total ILC3s, NKp46+ ILC3s and AMs were enumerated by flow cytometry. (g) B6 and Il17/Il22−/− were aerosol infected with ~100 CFU Mtb and lung bacterial CFU were measured by plating (n=12/group). (h) Number of ILC1, ILC2, ILC3, CXCR5+ ILC3, and CXCR5+NKp46+ ILC3 were measured by flow cytometry (n=5/B6, n=8/Il17/Il22−/−). (i) FFPE lung sections were subjected to ISH with the mouse-Cxcl13 probe and the ratio of Cxcl13 mRNA+ area occupied per lung was quantified. (j) B6 mice received IL-23 blocking antibody (i.p.) 1 day prior to infection with ~100 CFU Mtb and the lung bacterial burden and (k) number of AMs, ILC2s and ILC3s were quanified at 14 dpi using plating and flow cytometry respectively (n=5/isotype, n=5–6/anti-IL-23), Iso = Isotype. (l) FFPE lung sections from 30 dpi Mtb infected mice were stained with antibodies to B220 and CD3, and the average size of B cell follicles were quantified in Ahrf/f, Ahrf/fRorγtCre, B6, Il17/Il22−/−, isotype-treated B6 and anti-IL-23-treated B6 Mtb-infected mice. All data shown as mean ± SD. Significance by either one way ANOVA (a-d) or Student’s t-test (e-l).
Here we show that circulating ILCs are activated and recruited to the lung during human TB infection. Direct transcriptome sequencing of ILCs from fresh human tissue revealed a co-ordinated response to infection. These data, therefore, support the unexpected participation of ILCs in the human immune response to TB. Crucially, we demonstrate the importance of ILC3s to the outcome of infection using multiple mouse models, showing that a reduction in lung ILC3s impaired early immune control of Mtb. The associated increase in lung bacterial burden coincided with decreased IL-17 and IL-22 production, compromised AM accumulation, and impaired iBALT organization which was dependent on the CXCR5 and CXCL13 axis; key aspects of the immune response to Mtb. Taken together, our findings show for the first time that ILCs respond to Mtb infection and play an important role in determining the outcome of disease during TB.
METHODS
Participants
TB-infected blood and plasma samples were obtained from the collection of urine, blood and sputum (CUBS) cohort, based at Prince Cyril Zulu Communicable Disease Centre and the Nelson R. Mandela School of Medicine. Fifty blood samples were taken, from participants with confirmed pulmonary TB (Gene Xpert, sputum smears or culture method), of which 27 were HIV co-infected and 23 were HIV negative. Control blood samples (TB−HIV−) were collected from the Females Rising through Empowerment, Support and Health (FRESH) cohort from Umlazi, Durban.
TB affected lung tissue samples were obtained from 33 participants undergoing surgical resections due to severe lung complications, including haemoptysis, bronchiectasis, persistent cavitatory disease, shrunken or collapsed lung or drug-resistant infection, at the King Dinuzulu Hospital in Durban, KwaZulu-Natal and Inkosi Albert Luthuli Central Hospital (IALCH) in Durban, KwaZulu-Natal. 6 TB− control samples with macroscopically normal tissue margins from lung cancer resections or other inflammatory lung diseases from IALCH in Durban, KwaZulu-Natal were included in the study.
For some histological studies, lung sections were obtained from parcipants with TB from the Tuberculosis Outpatient Clinic at the National Institute of Respiratory Diseases (INER) in Mexico City. Samples were obtained from participants prior to anti-Mtb treatment.
All participants provided informed consent and each study was approved by the respective institutional review boards including the Biomedical Research Ethics Committee of the University of KwaZulu-Natal or INER.
Sample preparation
Blood samples were processed from frozen PBMCs purified using standard ficoll separation. Samples were thawed in DNase-containing (25 units/ml) R10 (Sigma) at 37°C. Cells were rinsed and rested at 37°C for a minimum of one hour before undergoing red blood cell lysis by 5–10ml RBC lysis solution (Qiagen) for 20 minutes at room temperature. Cells were then stained with the appropriate antibody panel described below.
Blood for plasma isolation was centrifuged at 200 rpm for 10 minutes. The plasma layer was removed, frozen down in 1ml aliquots and stored at −80°C until needed. Later these samples were thawed at room temperature and vortexed thoroughly before usage.
Lung samples were processed from fresh tissue immediately following surgery. Resected tissues were washed with cold HBSS (Sigma) and dissected into smaller pieces. Tissues were rinsed again and resuspended in 10ml R10, containing DNAse (1μl/ml) and Collagenase (4μl/ml), and disassociated in a Gentle MACS dissociator (Miltenyi Biotec). Cells were rested in a shaking incubator at 37°C for 30 minutes and then further processed in the gentle MACS dissociator. After further resting (30 mins at 37°C) and washing steps, cells were strained through a 70μm cell strainer and washed one final time. Cells were lysed using 5–10ml RBC lysis buffer (Qiagen) and stained for flow cytometry analysis.
Mtb infection in mice
C57BL/6 (B6), Ifnγ−/−, Rag1−/−, Cxcr5−/−, Rag2γc−/−, Rorγt−/−, RorγtGFP mice were obtained from Jackson Laboratory (Bar Harbor, ME) and bred at Washington University in St. Louis. Il17−/− and Il22−/− mice were crossed at Washington University in St. Louis to obtain double knockout mice. Cbfbf/f, Cbfbf/fNKp46Cre25 breeder pairs were a generous gift from Dr. Wayne Yokoyama. Il13−/− breeder pairs were a generous gift from Dr. Michael Holtzman. Ahrf/f, Ahrf/fRorγtCre mice were generously provided by Dr. Marco Colonna. Experimental mice were age and sex-matched and used between 6–8 weeks of age. Mtb W. Beijing strain, HN878, was cultured to mid-log phase in Proskauer Beck medium containing 0.05% Tween 80 and frozen in 1ml aliquots at −80°C. Mice were infected with aerosolized ~100 CFU of bacteria using a Glas-Col airborne infection system. Lungs were harvested, homogenized and serial dilutions of tissue homogenates were plated on 7H11 plates and CFU counted. Anti-IL-23 (Amgen, 16E5, 500μg per mouse) and mouse IgG1 isotype (500μg per mouse) were generously provided by Amgen and intraperitoneally (i.p.) injected into B6 mice one day prior to infection. Anti-NK1.1 (PK136, 100μg per mouse) and mouse IgG2a isotype (100μg per mouse) were kindly provided by Dr. Wayne Yokoyama and injected i.p. on day 0 and every 3 days post-infection.
Flow cytometry
Blood and lung tissue human ILCs were identified by a surface stain that included a near-infrared live/dead cell viability cell staining kit (Invitrogen) and the following monoclonal antibodies: CRTH2 (clone BM16, BD Biosciences), CD127 (clone R34.34, Beckman Coulter), CD117 (clone 104D2, BioLegend), CD56 (clone HCD56, BioLegend), CD25 (clone BC96, BioLegend), CD94 (clone HP-3D9, BD Biosciences), CD161 (clone HP-3G10, BioLegend), NKp44 (clone Z231, Beckman Coulter), CD16 (clone 3G8, BioLegend), CD4 (clone RPA-T4, BD Biosciences), and CD45 (clone HI30, BD Biosciences). Lineage markers CD19 (clone HIB19, BD Biosciences), CD34 (clone 561, BioLegend), CD14 (clone HCD14, BioLegend), CD4 (clone OKT4, BioLegend), TCRαβ (clone IP26, BioLegend), TCRγδ (clone B1, BioLegend), BDCA2 (clone 201A, BioLegend) and FcER1 (clone AER-37 (CRA1), eBioscience). Intracellular stains were done following Fix/Perm kit (BD Biosciences) and included CD3 (clone UCHT1, BD Biosciences) or CD3 (clone HIT3A, BD Biosciences).
Modified antibody panels were used to stain for markers of apoptosis or lung-homing. These panels consisted of a near-infrared live/dead cell viability cell staining kit (Invitrogen) and the following monoclonal antibodies: CD117 (clone 104D2, Biolegend), CD45 (clone HI30, BD Biosciences), CD161 (clone HP-3G10, BioLegend), CD56 (clone HCD56, BioLegend), CD94 (clone HP3D9, BD Bioscience), CD127 (clone R34.34, Beckman Coulter), CRTH2 (clone BM16, BD Biosciences), CD19 (SJ25C1, BD Bioscience), CD3 (OKT3, Biolegend) or CD69 (clone FNSO, BioLegend), CD4 (clone RPA-T4, BD Bioscience), CXCR3 (clone 1C6, BD Bioscience) or CD3 (clone UCHT1, BD Biosciences), CXCR5 (clone RF8B2, BD Bioscience) and CD103 (clone Ber-ACT8, Biolegend). Intracellular stains were done following Fix/Perm kit (BD Biosciences) and included caspase-3 (clone C92–605, BD Bioscience) and BCL2 (clone 100, BD Bioscience).
Cells were surface stained with 25μl of the appropriate antibody panel at room temperature in the dark, for 20 minutes. Following the BD Bioscience Fix/Perm step, cells were stained with the corresponding intracellular panel for a minimum of 20 minutes in the dark before being fixed with 2% paraformaldehyde. Fixed cells were acquired on a 4 laser BD Fortessa flow cytometer (CUBS and fresh blood samples) or a 5 laser FACSARIA Fusion (Lung, chemokine and apoptosis experiment samples) within 24 hours of processing.
Murine lung cell isolation and preparation were performed as described previously11. Briefly, mice were asphyxiated with CO2 and lungs were perfused with heparin in saline. Lungs were minced and incubated in collagenase/dnase (Sigma) for 30 minutes at 37°C. Lungs were pushed through a 70 μm nylon screen to release cells. Following red blood cell lysis, cells were used for flow cytometric analysis. The following antibodies were from TonBo Biosciences: CD127 (clone A7R34), CD3 (clone 145–2C11), CD19 (clone 1D3). Antibodies purchased from eBioscience were: RORc(γt) (clone AFKJS-9) and Sca-I (clone D7). CD45 (clone 30-F11), CCR6 (clone 140706), IL-17 (TC11–18H10), Streptavidin and CXCR5 (clone 2G8) were purchased from Becton Dickinson. The following antibodies were from Invitrogen: Biotinylated NKp46, TER-119 (clone TER-119), CD11c (clone N418), IL-22 (clone 1H8PWSR) and CD5 (clone 53–7.3). Live-dead aqua was purchased from Thermo Fisher Scientific. For intracellular staining, fixation/permeabilization concentrate and diluent (eBioscience) were used to fix and permeabilize lung cells for 20 minutes. The cells were incubated overnight with the intracellular staining. Samples were run on a 4 laser BD Fortessa flow cytometer. All flow cytometry data were analysed using FlowJo version 9.7.6 (TreeStar).
Adoptive transfer
Total ILCs (excluding ILC1, CD45+CD127+Lin−NK1.1−) were purified on a FACSJazz machine from the lungs of Mtb-infected B6 mice following enrichment with CD45 and staining with the above mentioned antibodies. About 5000 sorted and highly purified ILCs were intratracheally transferred into the Rag2γc−/− mice.
ELISA
The Quantikine ELISA assay for human CXCL/13/BLC/BCA-1 was used to measure the amount of CXCL13 in the plasma of 19 participants before and after 6 months of successful TB treatment. Standards, controls and samples were run in triplicate. Results were measured at 450nm using the GlowMax- Multi detection system (Promega). Concentrations were determined based on the standard curve generated on GraphPad prism version 6.0 (GraphPad Software, Inc.). Protein levels for mouse cytokines (IL-17, IL-22 and IL-23) in culture supernatants were measured using mouse ELISA kits or multiplex according to manufacturer’s instruction (R&D Systems, MBL International Corporation).
In vitro chemotaxis assays
10000 human ILCs were sorted in duplicate (1 control and 1 experiment per individual) from PBMCs by using the FACS panel described above, on a 5 laser FACSARIA Fusion. Cells were directly sorted into 100μl of freshly prepared media (HBSS containing 10% FBS) at 4°C and transferred into the top well of a Corning HTS 24-well transwell plate. Bottom chambers of transwell plates were loaded with 600μl of either media alone, for controls, or media and 500ng/ml of recombinant human CXCL13 (R&D Systems) for experimental wells. Transwell plates were incubated for 2 hours and then aspirate from bottom chamber was mixed with 50μl of precision count beads (BioLegend) and acquired on a FACSARIA Fusion. As antibody stains from intial sort remained visible, ILC3s were identified and then counted using counting beads as per manufacturers instruction.
For mouse chemotaxis assay, mouse ILCs (excluding ILC1, CD45+CD127+Lin−NK1.1−) were sorted from Mtb-infected B6 mice after CD45 enrichment within the total lung cells using the staining panel described above, on a FACSJAZZ machine. Cells were directly sorted into 100μl of freshly prepared media (HBSS containing 10% FBS) at 4°C and transferred into the top well of a Corning HTS 24-well transwell plate. Bottom chambers of transwell plates were loaded with 600μl of either media alone, for controls, or media and 500ng/mL of recombinant mouse CXCL13 (R&D Systems) for experimental wells. Transwell plates were incubated for 2 hours and then aspirate from bottom chamber was stained using the ILC3 marker panel on 4 laser BD Fortessa flow cytometer to determine the exact number of ILC3 migrating in response to the CXCL13 gradient.
Multiplex Fluorescent Immunohistology
Fluorescent immunohistology was either performed on histological sections of TB-infected lung tissues that were either supplied by Dr. Pratista Ramdial of IALCH or prepared in-house from formalin-fixed lung tissue following resections. Sections were dried overnight at 60°C and then processed using an Opal 4-colour Manual IHC kit (Perkin Elmer) as per manufacturer’s instructions with CD20 (1:400), CD3 (1:400) and CD127 (1:100), VIP (1:100) and OSM (1:100) as primary antibodies. Slides were scanned on a Zeiss Axio Observer microscope using TissueFAXS imaging software (Tissuegnostics) and analysed using TissueQuest analysis software (Tissuegnostics).
Whole Transcriptome Amplification and RNA Sequencing
ILC2 and ILC3 populations were sorted from lung tissue from 5 TB-infected and 2 cancer control participants using a 5 laser FACSARIA Fusion. A validated 17-colour FACS panel (Extended Data Fig. 1), and stringent gating was used to identify ILC2 and ILC3 populations in these samples. Cells were directly sorted into RLT buffer (Qiagen) + 1% β-Mercaptoethanol. Lysates were snap frozen on dry ice and stored at −80°C. As input numbers were low (50–1385 cells), thawed lysate was split into three technical replicates for each sample to increase the probability of successful amplification. RNA extraction, cDNA conversion and whole transcriptome amplification was carried out as previously described using Smart-seq29. Quality of the amplified product was confirmed using a high sensitivity DNA analysis kit and a 2100 BioAnalyzer (Aligent Technologies), and concentrations measured using a Qubit assay kit (ThermoFisher Scientific). Diluted samples were tagmented, amplified, and individually barcoded using a Nextera XT DNA Library prep kit (Illumina), cleaned using AMPure XP SPRI beads (Beckman Coulter) and sequenced on a NextSeq 500 (Illumina) using 30×30 PE reads with 8×8 index reads to an average depth of 14.9×10⁶ reads.
mRNA expression
RNA was extracted from the sorted murine ILCs (CD45+CD127+Lin−NK1.1−) using the Qiagen RNeasy Mini kit (Qiagen). cDNA was generated using ABI reverse transcription reagents (ABI, ThermoFisher) and RT-PCR was run on a Viia7 Real-Time PCR system (Life Technologies, Thermo Fisher). The relative expression of Ccr6, Rorγt, and Ahr in sorted ILCs was calculated over expression of GAPDH in each sample. The primer and probe sequences for murine glyceraldehyde 3-phosphate dehydrogenase (GAPDH) were previously published11. The primer and probes for murine Cccr6, Rorγt, and Ahr were purchased from Applied Biosystems.
RNA-Seq Data Analysis
Sequencing data from the NextSeq 500 was demultiplexed and aligned against hg38 using TopHat27, and expression values, in counts, were generated in RSEM28 for every sample. Samples with fewer than 106 aligned transcriptionally reads, or fewer than 10,000 measured genes, and genes expressed with fewer than 5 counts in fewer than 4 samples were discarded from subsequent analysis.
Differential expression analysis was performed in R (build 3.3.2) using the DESeq2 package29 (version 1.14.1) on ILC2s and ILC3s between samples (and replicates) from 5 TB positive and 2 TB negative individuals. The DESeq2 results can be found in Supplementary Tables 1 and 2; hits with FDR q< 0.01 were considered differentially expressed for downstream analyses. DE genes and their significances and log fold changes for each comparison were then processed using Ingenuity Pathway Analysis (Qiagen, https://www.qiagenbioinformatics.com/products/ingenuity-pathway-analysis) to populate lists of predicted upstream drivers (Supplementary Tables 3 and 4). Upstream driver plots were generated from the “Upstream Analysis” on IPA; hits with ‘Molecule Type’ including the word “chemical”, ‘p-value of overlap’ > 0.01, and number of ‘Target molecules in dataset’ < 3 were excluded from plotting. OSM upstream driver network was created using the Mechanistic Networks generated by IPA, using a p-value< 0.01 for overlap significance. The downstream driver network for genes known to interact with OSM was generated using the ClueGO plugin30 (version 2.3.3) in Cytoscape (version 3.3.0) with following ontologies: GO Biological Process, GO Immune System Process, KEGG, and REACTOME Pathways. Only pathways with significance of p < 0.01 after Benjamaini-Hochberg correction were shown, and a Kappa Score Threshold of 0.45 was used to merge terms. The downstream pathway bar chart was generated from the “Downstream Pathways” on IPA where large categories were manually annotated. All sequencing data is in the process of being publicy deposited and will be available.
ILC3 staining and quantification
Immunohistochemical staining of human, NHP and mouse formalin-fixed paraffin-embedded (FFPE) lung sections were initially dewaxed in xylene prior to hydrating with decreasing graded alcohol and methanol passages. Antigen was retrieved via heat treatment in 92°C and EDTA buffer pH 8. Tissue staining with RORγt (Clone 6F3.1, Millipore for mouse; clone Q31–378, BD Bioscience for NHP and human), CD3 (clone SP7, Thermofisher for human, NHP and mouse) or PAX5 (Clone 24/Pax-5, BD Pharmingen, for human and NHP) or B220 antibody (clone RA3–6B2, BD Pharmingen) was performed for one hour in a humid chamber. Tissues were washed in Tris buffered saline pH7.4–7.6 prior to incubation with secondary antibody (Novocastra Post Primary, Leica) and polymer (Novolink Polymer, Leica). To develop the reaction, tissues were incubated with 3,3’-Diaminobenzidine chromogen (DAB, Leica). Singly stained sections (PAX5, B220) were incubated with DAB for 5 minutes and tissues receiving double staining (RORγt and CD3) were incubated overnight. Tissues were counterstained with haematoxylin and rinsed in water. All tissues were mounted with coverslips using glycerol mounting medium. CD3−RORγt+ ILC3 were quantified in the slides. Images were analyzed manually by counting the number of ILC3 cells per field. The analysis was done in a blinded manner.
Immunofluorescence staining and In situ Hybridization
Mouse lung lobes were perfused with 10% formalin, fixed and paraffin embedded. Briefly, the FFPE sections were processed to remove paraffin and then hydrated in 96% alcohol and phosphate-buffered saline. Antigens were retrieved with a DakoCytomation Target Retrieval Solution (Dako), and non-specific binding was blocked by using 5% (v/v) normal donkey serum and Fc block (BD Pharmingen). Sections were then probed with anti-B220 (clone RA3–6B2, BD Pharmingen; dilution: 1/100) and anti-CD3 (clone M-20, Santa Cruz Biotechnology, Santa Cruz, CA; dilution: 1/100) to detect B cell follicle formation. For B cell follicles analyses, follicles were outlined with the automated tool of the Zeiss Axioplan 2 microscope (Zeiss), and total area and average size was calculated in squared microns.
To detect CD3−RORγt+ ILC3s and CD20+ B cells in lungs of NHP11 and humans infected with TB, slides were incubated with primary goat anti-CD3-epsilon (clone M-20, Santa Cruz Biotechnology), mouse anti-human RORγt (clone 6F3.1, Milipore Sigma) and rabbit anti-human CD20 (LS-B2605–125, Lifespan Biosciences). To detect CD3−RORγt+ ILC3s and CD20+ B cells in mice lungs infected with TB, slides were incubated with primary goat anti-CD3-epsilon (clone M-20, Santa Cruz Biotechnology), monoclonal rabbit anti-mouse RORγt (clone EPR20006, Abcam) and APC-rat anti-mouse CD45R (B220, clone RA3–6B2, BD Biosciences). Slides were incubated with primary antibodies overnight, at room temperature in a humid chamber. Next day, slides were briefly washed in PBS, and primary antibodies were revealed with Alexa Fluor 568-donkey anti-goat IgG (A11057, Thermo Fisher Scientific), FITC-donkey anti-mouse IgG (715-095-150, Jackson ImmunoResearch Laboratories), biotin-donkey anti-rabbit (711-065-162, Jackson ImmunoResearch Laboratories) or Alexa Fluor 568-donkey anti-goat IgG (A11057, Thermo Fisher Scientific) and Alexa Fluor 488-donkey anti-rabbit IgG (711-546-152, Jackson ImmunoResearch Laboratories) for human/NHP slides or mouse slides respectively. Finally, streptavidin Alexa Fluor 680 (S32358, Thermo Fisher Scientific) was added to the slides to visualize CD20 for human/NHP sections. Slides were washed in PBS and mounted with Vectashield antifade mounting media with DAPI (Vector Laboratories, H-1200). ILC3 were counted in 3–5 random 200× fields in each individual slide. 200× representative pictures were taken with Axioplan Zeiss Microscope and recorded with a Hamamatsu camera.
FFPE lung sections were subjected to in situ hybridization (ISH) with the mouse-Cxcl13 probe using the RNAscope 2.5HD Detection Kit (Brown staining) as per the manufacturer’s instruction (Advanced Cell Diagnostics, Newark, CA). The representative pictures were captured with the Hamamatsu Nanozoomer 2.0 HT system with NDP scan image acquisition software. The Cxcl13 positive and total area per lobe was quantified in a 40× magnification. Ratio was calculated by dividing Cxcl13 positive area by total area on each lobe.
Statistical Analyses
Where MFI data were measured at different time points, MFI was converted to final relative MFI by normalizing each measurement by an internal control to standardize these measurements over time31. The Mann-Whitney U test was used to determine statistical significance between two groups only while significance between more than two groups was calculated using the Dunn’s multiple comparisons test or a Mann-Whitney U test with Bonferroni corrections. Comparisons between matched samples where data were paired were analysed with the Wilcoxon matched-pairs signed rank test. All statistical analyses were performed using GraphPad Prism version 6.0d (GraphPad Software, Inc.)
In mouse studies, differences between the means of two groups were analyzed using two-tailed student’s t-test in Prism 5 (GraphPad). Differences between the means of three or more groups were analyzed using One-way ANOVA with Tukey’s post-test. A p-value of <0.05 was considered significant.
Data availability.
All relevant data are available from the authors. RNA sequence data that support the findings of this study will be deposited in publicly accessible database.
Extended Data
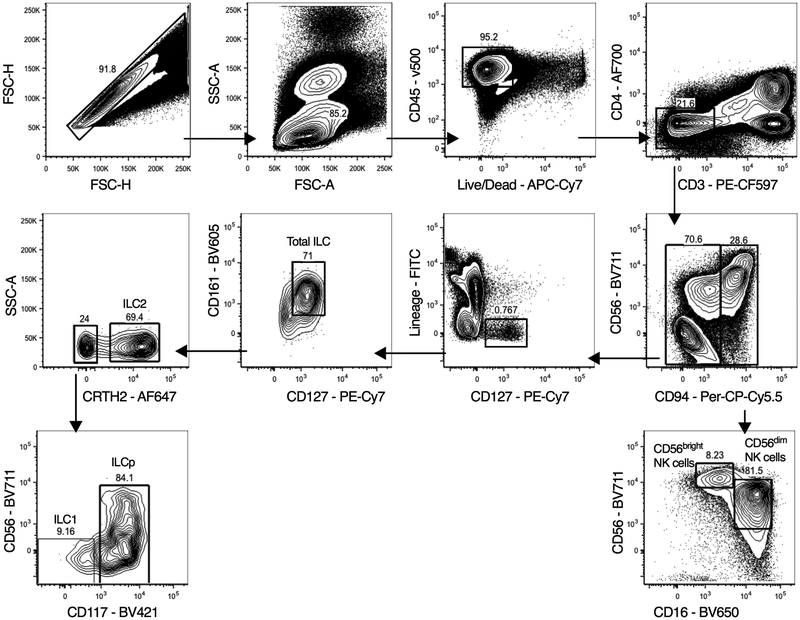
Extended Data Figure 1. Hierarchical gating strategy used to identify lymphocyte populations in human blood and lung samples.
Single cells from blood or lung samples from human participants were processed for flow cytometry, and all doublets were excluded. Cells were gated as lymphocytes, live, CD45+ and CD3+ T cells or CD3− cells. CD3− cells were gated on CD56 and CD94. CD94+ cells are NK cells and were further sub-gated as CD16−CD56hi NK cells or CD16+CD56dim NK cells. ILCs in the CD94− fraction were CD127+ and negative for all lineage markers CD4, CD11c, CD14, CD19, CD34, FcER1, BDCA2, TCRαβ and TCRγδ. Total ILCs were CD127+CD161+, ILC2 were Lin−CD127+CRTH2+ cells. ILC1 were Lin−CD127+CRTH2−CD56−CD117− cells. ILC3 were Lin−CD127+CRTH2−CD117+ cells with variable CD56 expression.
Extended Data Figure 2. ILC depletion seen in TB participants is not affected by TB drug resistance or concurrent HIV infection.
(a) The frequencies of the two main circulating NK populations, CD16+CD56dim and CD16−CD56hi were measured in human participants with TB and healthy controls by flow cytometry. NK cell frequencies in paired samples taken from the same TB participant before and after 6 months of standard and successful TB therapy were also determined by flow cytometry. (b). Percentages of blood ILC1, ILC2, ILC3, CD56dim NK cells, and CD56hi NK cells in TB−HIV− control subjects, TB participants without (TB+HIV−) and with HIV co-infection (TB+HIV+), and multi-drug resistant TB participants without (MDRTB+HIV−) and with HIV co-infection (MDRTB+HIV+) were measured. Significance calculated by a Dunn’s multiple comparison test. Where p-value not shown, *p<0.05, **p<0.01. (c) Capase-3 expression in circulating lymphocytes from peripheral blood of TB participants and controls was done by flow cytometry. Significance calculated using a Mann-Whitney U test.
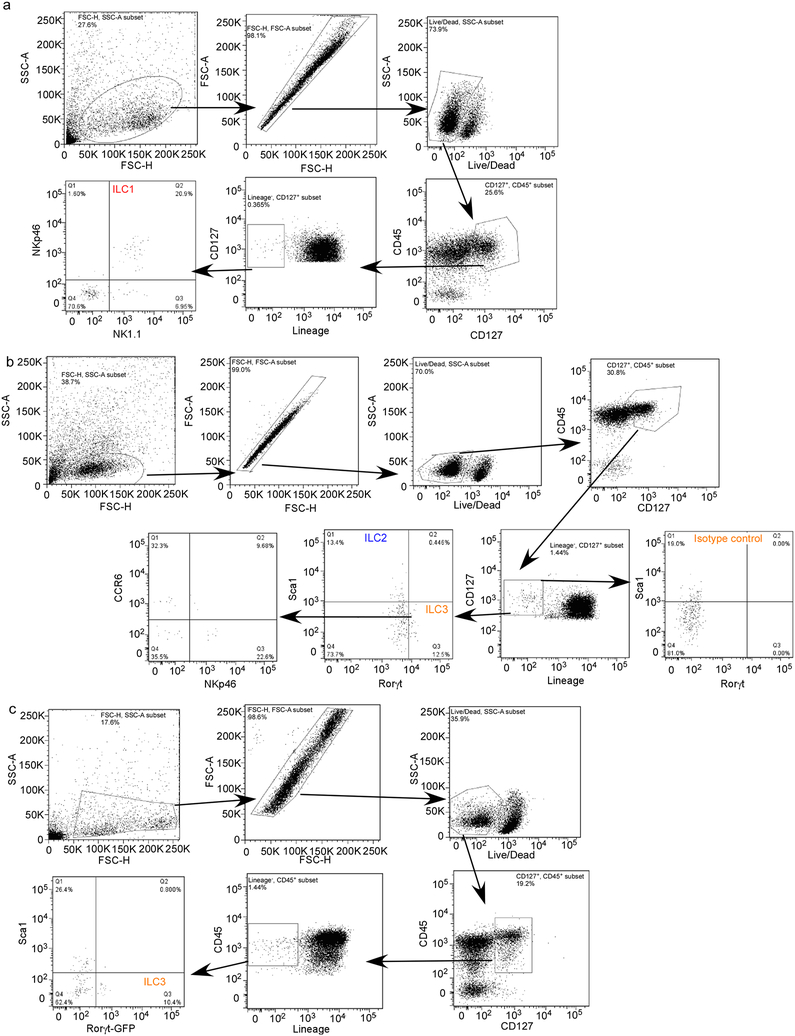
Extended Data Figure 3. Hierarchical gating strategy used to identify ILC populations in mouse lung.
(a-c) B6 mice were aerosol infected with ~100 CFU Mtb and lungs were harvested at different dpi and flow cytometric analysis was carried out on single cell suspensions. Flow gating strategy for (a) ILC1 (CD45+CD127+Lin−NKp46+NK1.1+), (b) ILC2 (CD45+CD127+Lin−NK1.1−Sca1+), and ILC3 (CD45+CD127+Lin−NK1.1−Rorγt+) and NKp46-expressing (CD45+CD127+Lin−NK1.1−Rorγt+NKp46+) ILC3 cells are shown. (c) Rorγt-GFP mice were aerosol infected with ~100 CFU Mtb and lungs were harvested at 14 dpi. ILC3 (CD45+CD127+Lin−NK1.1−GFP+) populations were quantified using flow cytometry.
Extended Data Figure 4. Pulmonary ILCs are tissue resident and express markers of migration.
(a) CD69, CD103, CD62L and NKp44 expression on the circulating ILCs in human peripheral blood and lung tissue were measured by flow cytometry. Significance by unpaired Mann-Whitney U test. Percentage of total human ILCs expressing these markers in paired samples of TB participants shown. Significance calculated using a one-way Wilcoxon-matched paired test. (b,c) NKp44, CD56 expression were measured in TB-infected lung tissues in comparison to control samples. Significance by unpaired Mann-Whitney U test (b) and a Kruskal-Wallis test with adjustments for multiple comparisons (c). (d) Percentages of ILC1, ILC2, ILC3, CD56dim NK cells, and CD56hi NK cells in human lung tissue were measured by flow cytometry TB−HIV− control subjects, TB participants without (TB+HIV−) and with HIV co-infection (TB+HIV+). (e) CXCL13 protein levels were measured in the plasma from TB participants without (TB+HIV−) and with HIV co-infection (TB+HIV+). Significance calculated by Mann-Whitney U test (no significance after Bonferonni correction). (f) Frequencies of CD103+ ILCs were measured by flow cytometry in the blood from TB−HIV− control subjects, TB participants without (TB+HIV−) and with HIV co-infection (TB+HIV+). Significance by Mann-Whitney U test with Bonferroni corrections (only significant values after correction shown). (g) Representative FACS plots showing two distinct subpopulations of CD103 and CXCR5-expressing ILCs measured in lung tissues from three TB+ subjects, where most CXCR5-expressing cells are CD117+ ILC3s, and CD103+ lung ILCs are a combination of CD117+ ILC3s, CRTH2+ ILCs and CD117−CRTH2− cells. Green = CD117+; Red = CRTH2+. (h) B6 mice were aerosol infected with ~100 CFU Mtb and lungs were harvested at 14 dpi. Lung ILCs were sorted from single cell suspensions (ILCs: CD45+CD127+Lin−NK1.1−). The ability of sorted ILCs to migrate towards media alone or mouse CXCL13 gradient was quantitated in transwell migration assay. n=3–5 biological replicates. Significance by one way ANOVA, *p<0.05, **p<0.01. (i) Human ILC3s sorted from lungs migrated in response to recombinant human CXCL13 in transwell migration assays. Significance by one tailed t-test.
Extended Data Figure 5.
IHC staining for nuclear RORγt, CD3, and PAX5 on paraffin-embedded formalin fixed lung tissues from (a, left) PTB or influenza-infected human participants, (a, right) or macaque with LTBI and PTB. (b) Representative fluorescent immunohistology scans of TB-infected human and non-human primate lung tissues, with CD20 (FITC), CD3 (PE-Texas Red) and CD127 (PE-Cy5). CD3−CD127+ ILCs are present adjacent to follicles (upper panels) and granuloma-like structures (lower panels). (c) Total numbers of ILCs/mm2 of tissue are increased in structures of TB histopathlogy (combined lesional tissue) in comparison to remainder of unaffected tissue (Non-Lesional). But percentages of ILCs per total cell number (DAPI+ cells) are not different between regions of interest (Lesional tissue) and unaffected tissue (Non-Lesional). ILC3 immunofluorescence for nuclear RORγt, B220 and CD3 on FFPE lung tissues from (d) human and (e) macaque with PTB and LTBI.
Extended Data Figure 6. Sort purity of human ILC3 and CD4+ T cells.
ILC3s and CD4+ T cells were sorted from human PBMCs and reflowed back into FACSARIA fusion to confirm purity. Purity of ILC3s confirmed as 100% and CD4+ T cells sort was 97% pure.
Extended Data Figure 7. VIP and OSM are expressed within human TB infected lung tissue.
(a) VIP and (b) OSM protein expression was confirmed in situ in TB-infected human lung tissues using multiplexed fluorescent immunohistology. (c) The network of upstream drivers enriched in the differentially expressed genes in sorted ILC3s between TB infected and uninfected samples are shown. Inset: GO Network generated over the genes identified as downstream of OSM by IPA (n=64, see Methods). Each node represents a specific GO/KEGG/Reactome term (Supplementary Table 4). Broad categories of pathways are annotated. Line width/darkness corresponds to number of shared genes between nodes. Node size: ** p<0.01, *** p<0.001. (d) Select predicted downstream pathways enriched in the differentially expressed genes in ILC3s between TB infected and uninfected samples are shown.
Extended Data Figure 8. Sorting purity of mouse ILCs.
(a) B6 mice were aerosol infected with ~100 CFU Mtb and lungs were harvested at 5 dpi. Lung CD45 population was enriched by using CD45 Microbeads. CD45 enriched cells were stained and lung ILCs (CD45+CD127+Lin−NK1.1−) were purified by using FACSJazz. Sort purity is shown here. (b) mRNA expression of Ccr6, Rorγt and Ahr relative to GAPDH on the purified ILCs (CD45+CD127+Lin−NK1.1−) and non ILC population (CD45+CD127−Lin−NK1.1−) were quantitated by RT-PCR. Significance by two way ANOVA, ****p<0.0001.
Extended Data Figure 9. ILC1 and ILC2 are dispensable, while ILC3 is required for early protection against TB.
B6 (n=5–10), Ifnγ−/−(n=3–7), Il13−/− (n=5–15) and Rorγt−/− (n=4–5) mice were aerosol infected with ~100 CFU Mtb and at 14 dpi, (a, c) bacterial burden was measured in the lungs by plating (n=5–9/B6). (b, d) Numbers of lung ILC1s, ILC2s and ILC3s were quantified by using flow cytometry. Significance by one way ANOVA (a, b) or Student’s t-test (c,d). (e) Cbfbf/fNKp46Cre and Cbfbf/f mice were aerosol infected with ~100 CFU Mtb and at 14 and 30 dpi (e) bacterial burden was determined in the lungs by plating (n=5–11/Cbfbf/f, n=3–11/Cbfbf/f Nkp46cre), (f) Numbers of lung ILC1s, ILC2s, ILC3s and AMs were determined by using flow cytometry, (g) FFPE lung sections from 30 dpi Mtb-infected mice were stained with antibodies to B220 and CD3, and the average size of B cell follicles were quantified. (h) Uninfected Cbfbf/fNKp46Cre and Cbfbf/f mice were harvested, and lung and lymph nodes were analysed for the different myeloid (AMs, myeloid Dendritic Cells (mDCs), neutrophils, monocytes and recruited macrophages) and (i) T cell (CD3+CD4+, CD3+CD8+, CD3+TCRα+, CD3+γδ+) populations by flow cytometry. Significance by Student’s t-test.
Extended Data Figure 10. IL-17 and IL-22 are produced by lung ILCs following Mtb infection and mediate protection through the CXCR5 axis.
B6 mice were aerosol infected with ~100 CFU Mtb and treated with isotype (n=5) or anti-NK1.1 (n=5, PK126, 100 μg) every 3 days. (a) Lung NK cells were determined following treatment with isotype or anti-NK1.1 at 30 dpi by flow cytometry. (b) Lung bacterial burden was assessed at 30 dpi. All data shown as mean ± SD. Significance calculated by Student’s t-test (a-b). (c-d) Uninfected Ahrf/f and Ahrf/f Rorγtcre mice were harvested, and lung and lymph nodes were analyzed for the different myeloid (c, AMs, mDCs, neutrophils, monocytes and recruited macrophages) and (d) T cell (CD3+CD4+, CD3+CD8+, CD3+TCRα+, CD3+γδ+) populations by flow cytometry (n=9). (e) Lung cells from B6 mice were infected in vitro with MOI 0.1 Mtb and IL-23 (n=3/UI, n=4/Mtb) protein levels were measured in supernatants on 5 dpi and compared to uninfected (UI) cells (f, left). Lung cells from B6 mice were infected in vitro with MOI 0.1 Mtb as before and stimulated with recombinant (r) IL-23, rIL-1β and the protein levels of IL-22 and IL-17 were measured in supernatants and compared with levels in uninfected (UI) cells and (f, right) the numbers of IL-17 and IL-22 producing ILCs were measured by flow cytometry. (g) B6 and Cxcr5−/− mice were aerosol infected with ~100 CFU Mtb and at 30 dpi bacterial burden was determined in the lungs by plating (n=5). (h) ILC3 quantification in FFPE lung sections was carried out by staining with CD3, B220 and Rorγt and the number of Rorγt+CD3− ILC3 were counted and shown. (i) FFPE lung sections from 30 dpi Mtb infected mice were stained with antibodies to B220 and CD3, and the average size of B cell follicles were quantified. All data shown as mean ± SD. Significance by Student’s t-test (c-i).
Supplementary Material
Acknowledgements
This work was supported by Washington University in St. Louis, NIH grant HL105427, AI111914–02 and AI123780 to S.A.K. and D.K., AI134236–02 to S.A.K., M.C. and D.K., and NIH/NHLBI T32 HL007317–37 to R.D-G. Department of Molecular Microbiology, Washington University St Louis, and Stephen I. Morse Fellowship to S.D., T32 HL 7317–39 to N.C.H. and T32-AI007172 to M.D. J.R-M. was supported by funds of the Department of Medicine, University of Rochester, and NIH grant U19 AI91036. A.S. was supported, in part, by the Searle Scholars Program, the Beckman Young Investigator Program, a Sloan Fellowship in Chemistry, the NIH (5U24AI118672), the Bill and Melinda Gates Foundation, and the Ragon Institute. S.W.K was supported by an NSF Graduate Student Fellowship Award and the Hugh Hampton Young Memorial Fund Fellowship The authors thank Amgen for providing anti-IL-23 antibody for the study. The authors thank Dr. Jennifer Bando for helping with the flow cytometry. The authors thank Dr. Michael Holtzman for generously gifting Il13−/− mice.
Footnotes
The authors declare no competing interests.
REFERENCES
- 1.World Health Organization. Global Tuberculosis Report 2018. Geneva, S. W. [Google Scholar]
- 2.Klose CS & Artis D Innate lymphoid cells as regulators of immunity, inflammation and tissue homeostasis. Nat Immunol 17, 765–774, doi: 10.1038/ni.3489 (2016). [DOI] [PubMed] [Google Scholar]
- 3.Diefenbach A, Colonna M & Koyasu S Development, differentiation, and diversity of innate lymphoid cells. Immunity 41, 354–365, doi: 10.1016/j.immuni.2014.09.005 (2014). [DOI] [PMC free article] [PubMed] [Google Scholar]
- 4.Takatori H et al. Lymphoid tissue inducer-like cells are an innate source of IL-17 and IL-22. J Exp Med 206, 35–41, doi: 10.1084/jem.20072713 (2009). [DOI] [PMC free article] [PubMed] [Google Scholar]
- 5.Jones GW & Jones SA Ectopic lymphoid follicles: inducible centres for generating antigen-specific immune responses within tissues. Immunology 147, 141–151, doi: 10.1111/imm.12554 (2016). [DOI] [PMC free article] [PubMed] [Google Scholar]
- 6.Lim AI et al. Systemic Human ILC Precursors Provide a Substrate for Tissue ILC Differentiation. Cell 168, 1086–1100 e1010, doi: 10.1016/j.cell.2017.02.021 (2017). [DOI] [PubMed] [Google Scholar]
- 7.Monticelli LA et al. Innate lymphoid cells promote lung-tissue homeostasis after infection with influenza virus. Nat Immunol 12, 1045–1054, doi: 10.1031/ni.2131 (2011). [DOI] [PMC free article] [PubMed] [Google Scholar]
- 8.McHedlidze T et al. Interleukin-33-dependent innate lymphoid cells mediate hepatic fibrosis. Immunity 39, 357–371, doi: 10.1016/j.immuni.2013.07.018 (2013). [DOI] [PMC free article] [PubMed] [Google Scholar]
- 9.Kloverpris HN et al. Innate Lymphoid Cells Are Depleted Irreversibly during Acute HIV-1 Infection in the Absence of Viral Suppression. Immunity 44, 391–405, doi: 10.1016/j.immuni.2016.01.006 (2016). [DOI] [PMC free article] [PubMed] [Google Scholar]
- 10.Hedfors IA & Brinchmann JE Long-term proliferation and survival of in vitro-activated T cells is dependent on Interleukin-2 receptor signalling but not on the high-affinity IL-2R. Scand J Immunol 58, 522–532 (2003). [DOI] [PubMed] [Google Scholar]
- 11.Slight SR et al. CXCR5(+) T helper cells mediate protective immunity against tuberculosis. J Clin Invest 123, 712–726, doi: 10.1172/JCI65728 (2013). [DOI] [PMC free article] [PubMed] [Google Scholar]
- 12.Constantinides MG, McDonald BD, Verhoef PA & Bendelac A A committed precursor to innate lymphoid cells. Nature 508, 397–401, doi: 10.1038/nature13047 (2014). [DOI] [PMC free article] [PubMed] [Google Scholar]
- 13.Moro K et al. Innate production of T(H)2 cytokines by adipose tissue-associated c-Kit(+)Sca-1(+) lymphoid cells. Nature 463, 540–544, doi: 10.1038/nature08636 (2010). [DOI] [PubMed] [Google Scholar]
- 14.Dorhoi A et al. The adaptor molecule CARD9 is essential for tuberculosis control. J Exp Med 207, 777–792, doi: 10.1084/jem.20090067 (2010). [DOI] [PMC free article] [PubMed] [Google Scholar]
- 15.Traber KE et al. Induction of STAT3-Dependent CXCL5 Expression and Neutrophil Recruitment by Oncostatin-M during Pneumonia. Am J Respir Cell Mol Biol 53, 479–488, doi: 10.1165/rcmb.2014-0342OC (2015). [DOI] [PMC free article] [PubMed] [Google Scholar]
- 16.Nouailles G et al. CXCL5-secreting pulmonary epithelial cells drive destructive neutrophilic inflammation in tuberculosis. J Clin Invest 124, 1268–1282, doi: 10.1172/JCI72030 (2014). [DOI] [PMC free article] [PubMed] [Google Scholar]
- 17.Pagan AJ et al. Myeloid Growth Factors Promote Resistance to Mycobacterial Infection by Curtailing Granuloma Necrosis through Macrophage Replenishment. Cell Host Microbe 18, 15–26, doi: 10.1016/j.chom.2015.06.008 (2015). [DOI] [PMC free article] [PubMed] [Google Scholar]
- 18.van de Veerdonk FL et al. Mycobacterium tuberculosis induces IL-17A responses through TLR4 and dectin-1 and is critically dependent on endogenous IL-1. J Leukoc Biol 88, 227–232, doi: 10.1189/jlb.0809550 (2010). [DOI] [PubMed] [Google Scholar]
- 19.Yadav M & Schorey JS The beta-glucan receptor dectin-1 functions together with TLR2 to mediate macrophage activation by mycobacteria. Blood 108, 3168–3175, doi: 10.1182/blood-2006-05-024406 (2006). [DOI] [PMC free article] [PubMed] [Google Scholar]
- 20.El-Shazly AE et al. Novel association between vasoactive intestinal peptide and CRTH2 receptor in recruiting eosinophils: a possible biochemical mechanism for allergic eosinophilic inflammation of the airways. J Biol Chem 288, 1374–1384, doi: 10.1074/jbc.M112.422675 (2013). [DOI] [PMC free article] [PubMed] [Google Scholar]
- 21.Rajaram MV et al. Mycobacterium tuberculosis activates human macrophage peroxisome proliferator-activated receptor gamma linking mannose receptor recognition to regulation of immune responses. J Immunol 185, 929–942, doi: 10.4049/jimmunol.1000866 (2010). [DOI] [PMC free article] [PubMed] [Google Scholar]
- 22.Tientcheu LD et al. Differential transcriptomic and metabolic profiles of M. africanum- and M. tuberculosis-infected patients after, but not before, drug treatment. Genes Immun 16, 347–355, doi: 10.1038/gene.2015.21 (2015). [DOI] [PMC free article] [PubMed] [Google Scholar]
- 23.O’Kane CM, Elkington PT & Friedland JS Monocyte-dependent oncostatin M and TNF-alpha synergize to stimulate unopposed matrix metalloproteinase-1/3 secretion from human lung fibroblasts in tuberculosis. Eur J Immunol 38, 1321–1330, doi: 10.1002/eji.200737855 (2008). [DOI] [PubMed] [Google Scholar]
- 24.Khader SA et al. IL-23 and IL-17 in the establishment of protective pulmonary CD4+ T cell responses after vaccination and during Mycobacterium tuberculosis challenge. Nat Immunol 8, 369–377, doi: 10.1038/ni1449 (2007). [DOI] [PubMed] [Google Scholar]
- 25.Ebihara T et al. Runx3 specifies lineage commitment of innate lymphoid cells. Nat Immunol 16, 1124–1133, doi: 10.1038/ni.3272 (2015). [DOI] [PMC free article] [PubMed] [Google Scholar]
- 26.Cupedo T et al. Human fetal lymphoid tissue-inducer cells are interleukin 17-producing precursors to RORC+ CD127+ natural killer-like cells. Nat Immunol 10, 66–74, doi: 10.1038/ni.1668 (2009). [DOI] [PubMed] [Google Scholar]
- 27.Trapnell C et al. Differential gene and transcript expression analysis of RNA-seq experiments with TopHat and Cufflinks. Nat Protoc 7, 562–578, doi: 10.1038/nprot.2012.016 (2012). [DOI] [PMC free article] [PubMed] [Google Scholar]
- 28.Li BD, RSEM CN: accurate transcript quantification from RNA-Seq data with or without a reference genome. BMC Bioinformatics 12 (2011). [DOI] [PMC free article] [PubMed] [Google Scholar]
- 29.Love MI, Huber W & Anders S Moderated estimation of fold change and dispersion for RNA-seq data with DESeq2. Genome Biol 15, 550, doi: 10.1186/s13059-014-0550-8 (2014). [DOI] [PMC free article] [PubMed] [Google Scholar]
- 30.Bindea G et al. ClueGO: a Cytoscape plug-in to decipher functionally grouped gene ontology and pathway annotation networks. Bioinformatics 25, 1091–1093, doi: 10.1093/bioinformatics/btp101 (2009). [DOI] [PMC free article] [PubMed] [Google Scholar]
- 31.Upreti D, Pathak A & Kung SK Development of a standardized flow cytometric method to conduct longitudinal analyses of intracellular CD3zeta expression in patients with head and neck cancer. Oncol Lett 11, 2199–2206, doi: 10.3892/ol.2016.4209 (2016). [DOI] [PMC free article] [PubMed] [Google Scholar]
Associated Data
This section collects any data citations, data availability statements, or supplementary materials included in this article.
Supplementary Materials
Data Availability Statement
All relevant data are available from the authors. RNA sequence data that support the findings of this study will be deposited in publicly accessible database.


