Abstract
There is a growing realization that some aging-associated phenotypes/diseases have an epigenetic basis. Here, we report the first genome-scale study of epigenomic dynamics during normal human aging. We identify aging-associated differentially methylated regions (aDMRs) in whole blood in a discovery cohort, and then replicate these aDMRs in sorted CD4+ T-cells and CD14+ monocytes in an independent cohort, suggesting that aDMRs occur in precursor haematopoietic cells. Further replication of the aDMRs in buccal cells, representing a tissue that originates from a different germ layer compared with blood, demonstrates that the aDMR signature is a multitissue phenomenon. Moreover, we demonstrate that aging-associated DNA hypermethylation occurs predominantly at bivalent chromatin domain promoters. This same category of promoters, associated with key developmental genes, is frequently hypermethylated in cancers and in vitro cell culture, pointing to a novel mechanistic link between aberrant hypermethylation in cancer, aging, and cell culture.
In biological terms, aging can be defined as cellular senescence, which results in a diminished ability to respond to stress, increased homeostatic imbalance and risk of diseases such as cancer, and eventually death. Research in a variety of organisms has revealed that many factors are involved in the aging process at the molecular level. These include telomere-shortening, accumulation of genetic mutations, oxidative stress, and molecular pathways altered by quantitative and qualitative changes in nutrition (for review, see Vijg and Campisi 2008).
More recently, several small-scale profiling studies have found directional epigenetic perturbations associated with aging in mammals (Fraga et al. 2005; Bjornsson et al. 2008; Boks et al. 2009; Christensen et al. 2009). Epigenetic modifications, such as DNA methylation and post-translational modifications of histone proteins, are indispensable for many aspects of genome function, including gene expression. The perturbation of epigenetic landscapes during aging could potentially influence cellular functions, thereby impacting on the development of various aging-associated phenotypes and/or diseases, such as cancer. However, until now, we have lacked a genome-scale view of aging-associated epigenomic dynamics. Such information would potentially reveal key genomic regions/features or molecular pathways that are susceptible to aging-related epigenetic perturbations. Here, we report the first genome-scale study of epigenomic dynamics during normal human aging. Our data support a model in which aging-associated differentially methylated regions (aDMRs) that gain methylation with age (hyper-aDMRs) arise in precursor/stem cells preferentially at bivalent chromatin domain promoters. This same category of promoters is frequently hypermethylated in cancers and in vitro cell culture, pointing to a novel mechanistic link between aberrant hypermethylation in cancer, aging, and cell culture.
Results
Genome-scale identification of human aging-associated differentially methylated regions (aDMRs) in whole blood
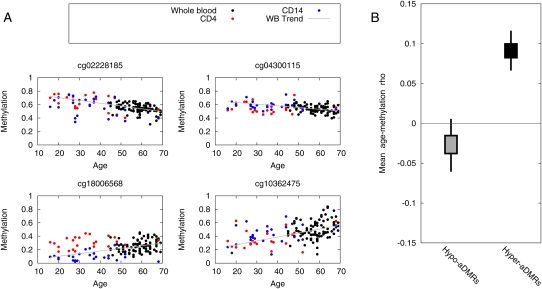
We performed genome-scale DNA methylation profiling of whole blood from 93 different healthy females (31 twin pairs and 31 singletons) ranging from 49 to 75 years of age (Supplemental Table 1). Profiling was performed using Illumina HumanMethylation27 BeadChips (Illumina 27K) that allows determination of bisulfite-conversion-based, single-CpG resolution DNA methylation levels at 27,578 different CpG sites within >14,000 promoters in the human genome. Approximately 80% of the promoters are represented by 2 CpG sites, and ∼88% of all CpG sites represented on the array are located within 750 base pairs (bp) of the transcriptional start site (TSS) of the associated gene. The Illumina27K array has shown to be quantitative and reproducible (Bibikova et al. 2009). To identify aging-associated differentially methylated regions (aDMRs), we calculated Spearman's rank correlation (ρ) between age and methylation (quantile-normalized beta scores) for each CpG site, and assigned a P-value (empirical statistics based on 1000 permutations). At P < 0.01—a pragmatic threshold for selecting CpG sites for further study, and not representative of the significance of the aDMR set as a whole—we observed 213 CpG sites that become more methylated with age (hyper-aDMRs) and 147 CpG sites that lose methylation with age (hypo-aDMRs). More than 95% of these aDMRs were located within 500 bp of the transcriptional start site of the associated gene (Supplemental Fig. 1). We also repeated the aDMR calling procedure on un-normalized raw Beta values, and found the aDMR lists derived from normalized and un-normalized data to be highly correlated (R2 = 0.93, calculated by taking the two vectors of Spearman's correlation coefficients of aDMR lists from normalized and unnormalized data sets, and then calculating the correlation-of-correlations). This demonstrates that the normalization procedure itself does not introduce significant artifacts in the final data set. Examples of aDMRs called at P < 0.01 from the normalized data set are shown in Fig. 1A. We also confirmed that CpGs neighboring the “index” aDMR CpGs show trends consistent with the original index aDMR CpG site (P < 10−5, bootstrapped; Fig. 1B). It is important to note that the aDMR-based analyses described below were implemented in terms of enrichment of CpGs (relative to the array as a whole), not enrichment of genes, thereby eliminating the possibility that the array design biased our findings (e.g., some promoters are represented by a single or >2 CpG sites).
Figure 1.
Aging-associated differentially methylated regions (aDMRs) found in human whole blood. (A) Methylation values (Beta scores from the Illumina Beadstudio software) are plotted as a function of age for 93 whole-blood samples, and 25 CD14+ monocyte and CD4+ T-cell samples. The whole-blood samples were collected from separate individuals than the sorted cells, and thus provide independent cross-validation. Trend lines show a least-squares fit to the whole-blood data set. Shown are four representative examples. A complete list of aDMRs is presented in Supplemental Table 3. (B) CpGs neighboring the aDMR CpG show similar age-related DNA methylation dynamics. For each CpG in the confirmed aDMR sets, we located the nearest neighbor (in terms of genomic location) represented on the array, and calculated the mean aging/methylation correlation of the two sets of neighbor CpGs. Box-and-whisker plots represent 50% and 95% credible intervals on the mean (bootstrapped).
Genome-scale validation of whole-blood aDMRs in CD14+ monocytes and CD4+ T-cells from an independent cohort
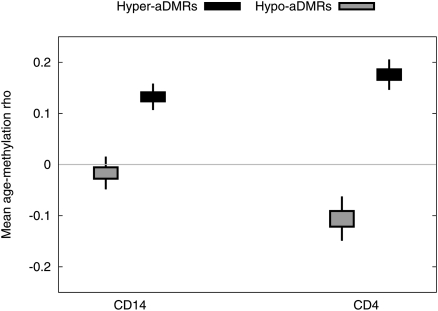
Although human aging-related DNA methylation dynamics have been investigated by several recent small-scale studies (Fraga et al. 2005; Bjornsson et al. 2008; Boks et al. 2009; Christensen et al. 2009), until now it has not been established whether aDMRs represent cell-intrinsic changes, or simply age-dependent changes in the cellular composition of tissues. To address this issue, we performed a genome-scale replication study, using Illumina 27K arrays, on sorted CD14+ monocytes and CD4+ T-cells from an independent cohort of 25 singletons (Supplemental Table 2). CD14+ monocytes are relatively short-lived cells (∼weeks) of the myeloid lineage, whereas CD4+ T-cells represent a variety of cell types with varying life spans (months–years) of the lymphoid lineage. Although the age range of the second cohort (20–54 yr with one donor 69 yr of age) did not perfectly overlap the age range of the first cohort (and the second cohort was comprised of 20 females and five males), this validation would still be appropriate for aDMRs that show aging-associated DNA methylation dynamics across a wide age range without a sex-specific bias. We found that hyper-aDMRs as a group show statistically significant replication in both CD4+ and CD14+ cells (P < 10−5 in both cases, bootstrapped; Fig. 2). Over 60% of whole-blood hyper-aDMRs (131/213) showed aging-associated hypermethylation in both CD14+ and CD4+ cells. Hypo-aDMRs showed significant replication in CD4+ cells (P < 10−5, bootstrapped), but were nonsignificant in CD14+ cells. False discovery rates (FDRs) were estimated as <20% for hyper-aDMRs and <35% for hypo-aDMRs (see Methods for a detailed description of FDR estimation). Based on these data, we conclude that the majority of identified hyper-aDMRs represent cell-intrinsic aging-associated epigenetic perturbations. Hypo-aDMRs did not replicate as clearly, probably because they reflect aging-associated changes in relative proportions of cell subtypes in whole blood. For subsequent analyses, we focused only on statistically significant whole-blood hyper-aDMRs that show the same directional aging-associated DNA methylation change in CD4+ and CD14+ cells (Supplemental Table 3).
Figure 2.
Validation of whole-blood aDMRs in CD14+ monocytes and CD4+ T-cells from an independent cohort. For each probe with a significant aging-methylation correlation in the whole-blood data (P < 0.01), we calculated Spearman's ρ values from the CD4+ and CD14+ data sets. We plot 50% and 95% credible intervals for the box-and-whisker plots on bootstrap estimates of the mean for each data set.
Hyper-aDMRs are associated with histone modifications typical of transcriptional inactivity
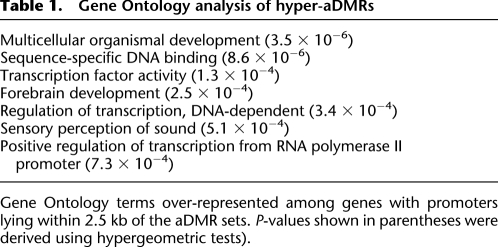
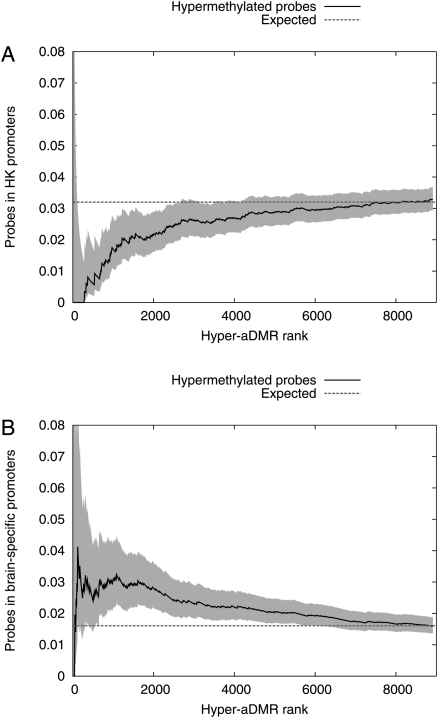
We found that hyper-aDMRs are strongly enriched for CpG islands (P < 10−6, χ2-test, CGIs were defined as length > 400 bases and CpGo/e > 0.6). Median methylation of the hyper-aDMRs is 5.4% and 9.9% in CD14+ and CD4+ cells, respectively, from the youngest 10 individuals, and this increases to a median methylation of 15.3% in the oldest 10 individuals in whole blood. A Gene Ontology (GO) analysis showed enrichment of tissue-specific functions, including neural cell-related processes (Table 1). Consistent with the GO analysis, comparison with previously published gene expression data revealed that hyper-aDMRs are depleted for ubiquitously expressed genes, but relatively enriched for genes expressed in neural cell types (P < 10−5 in both cases, bootstrapped; Fig. 3A,B). Based on these analyses, we hypothesized that our hyper-aDMRs are predominantly associated with CGI promoters that are transcriptionally moderately active, or inactive, in hematopoietic cells. Using chromatin immunoprecipitation with massively parallel sequencing (ChIP-seq) data sets for human resting CD4+ T-cells (Barski et al. 2007), we determined average levels of various histone modifications associated with hyper-aDMRs (Fig. 4A; Supplemental Fig. 2). We found that, at least in CD4+ T-cells, hyper-aDMR promoters are depleted for marks commonly associated with transcriptional activity, such as H3K4me3, H2AZ, and RNA polymerase II, but enriched for marks associated with transcriptional inactivity, such as H3K9me3 and H3K27me3 (P < 10−5 in all cases, bootstrapped).
Table 1.
Gene Ontology analysis of hyper-aDMRs
Gene Ontology terms over-represented among genes with promoters lying within 2.5 kb of the aDMR sets. P-values shown in parentheses were derived using hypergeometric tests).
Figure 3.
Hyper-aDMRs are not associated with housekeeping genes, but are enriched for neural-specific genes. (A) Probes were classified as “housekeeping” (HK) (lying within 2.5 kb of the TSS of a housekeeping gene according to Eisenberg and Levanon 2003) or otherwise. All probes with a positive methylation/age correlation were ranked in order of increasing P-value (i.e., decreasing probability of being a bona fide aDMR). For successively larger sets of probes from the top of the ranked list, we calculated the fraction of probes contained in the housekeeping set. (B) We subdivided CpG sites and indentified a brain-specific subset (lying within 2.5 kb of the TSS of a nervous system gene according to Dorus et al. 2004). Subsequent analysis is as for A. The filled regions indicate 95% credible intervals estimated from a Beta model.
Figure 4.
Hyper-aDMRs are enriched for inactive histone modifications in CD4+ T-cells and bivalent chromatin domains in embryonic/haematopoietic stem cells. We collected the maximum tag-count within 200 bp of each CpG site on the Illumina27K array for a range of published ChIP-seq data sets (Barski et al. 2007; Zhao et al. 2007; Cui et al. 2009) (A) The ratios are plotted of mean tag count in CD4+ T-cells across the hyper-aDMR set, to mean tag count across the data set as a whole. Boxes represent 50% credible intervals on our estimate of the ratio, and whiskers represent 95% credible intervals (bootstrapped). Box-and-whisker plots above “1” represent significant enrichment, whereas below “1” represents significant depletion relative to the genome average. A figure showing correlations with all the ChIP-seq data reported in Barski et al. (2007) is shown in Supplemental Figure 1. (B) As in A, but analysis of hyper-aDMR promoters in human embryonic and haematopoietic stem cells.
Hyper-aDMRs occur preferentially at bivalent chromatin domains in human embryonic and haematopoietic stem cells
Gradual hypermethylation of moderately active, or inactive CGI promoters—as observed for hyper-aDMRs—is reminiscent of a phenomenon recently reported by Meissner et al. (2008). They found that astrocytes differentiated from in vitro-derived mouse neural precursor cells (NPCs) acquire methylation at 10 times as many CGI promoters compared with astrocytes differentiated from in vivo–derived NPCs. The aberrantly hypermethylated promoters in in vitro–derived NPCs were found to be enriched for genes not expressed in NPCs or the astrocyte lineage. Rather, they are associated with a key set of developmentally regulated genes that harbor both active (H3K4me3) and inactive (H3K27me3) histone marks in embryonic stem (ES) cells—so-called bivalent chromatin domains (Azuara et al. 2006; Bernstein et al. 2006). Therefore, we analyzed published ChIP-seq profiles for H3K4me3 and H3K27me3 in human ES cells (Zhao et al. 2007) and haematopoietic stem cells (HSCs) (Cui et al. 2009), and found that hyper-aDMRs are indeed enriched for promoters that contain bivalent chromatin domains in ES cells, and bivalent chromatin domains or H3K27me3-only in HSCs cells (P < 10−5 in all cases, bootstrapped; Fig. 4B).
Bivalent chromatin domain hyper-aDMRs colocalize with regions hypermethylated in human cancers
Aberrant hypermethylation at bivalent chromatin domain promoters is also a key feature of several cancers (Ohm et al. 2007; Schlesinger et al. 2007; Widschwendter et al. 2007). We were therefore interested in investigating the correlation between the hyper-aDMRs we report here, and previously identified bivalent chromatin promoters found to be aberrantly hypermethylated in human cancers. For this analysis, we focused on a set of 28 different genes analyzed by Ohm et al. (2007). These 28 genes have been found to be frequently hypermethylated and silenced in multiple adult cancers by several different groups, and hence likely represent bona fide cancer-related epigenetic perturbations. Four of these 28 genes were identified as hyper-aDMRs in our study, which is more than expected by chance (P = 0.004, χ2-test). However, given the statistical uncertainty associated with small data sets, we used an alternative strategy, i.e., asking if the set of 28 genes, as a group, show aging-associated hypermethylation, regardless of whether the individual genes in the set were identified or not as hyper-aDMRs at the P < 0.01 cutoff we used in our study. We found that probes (on the arrays used in our study) associated with the promoters of the previously identified 28 genes do indeed show aging-associated hypermethylation (P = 0.0032, χ2-test).
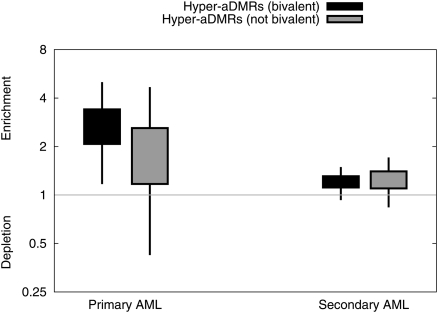
We also compared our hyper-aDMRs with data from a recent study that reported human genome-wide DNA methylation profiles for primary and secondary acute myeloid leukemia (AML) i.e., cancers of hematopoietic cells (Figueroa et al. 2009). A significant correlation was observed specifically between bivalent chromatin domain hyper-aDMRs and aberrantly methylated promoters in primary AML (P < 10−5, bootstrapped; Fig. 5), but not for nonbivalent chromatin domain promoters and primary AML, and either bivalent or nonbivalent chromatin domain hyper-aDMRs and secondary AML.
Figure 5.
Hyper-aDMRs are also hypermethylated in human leukaemia. We identified subsets of CpG sites as overlapping promoters (TSS ± 2.5 kb) of genes associated with leukemia according to Figueroa et al. (2009). For each of the two disease types, we calculated the enrichment of hyper-aDMRs amongst disease-associated CpGs relative to a model whereby aDMRs and disease genes occur independently. Boxes indicate 50% credible intervals on our estimate of this ratio, and whiskers indicate 95% intervals (Beta model).
Hyper-aDMRs from other human tissues are also enriched for promoters that harbor bivalent chromatin domains in embryonic stem cells
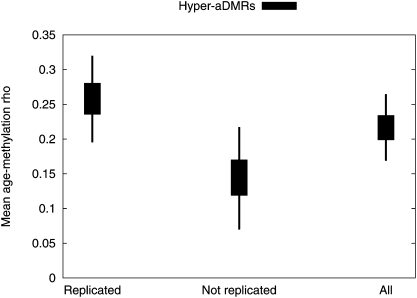
We then wanted to investigate whether the hyper-aDMR signature we observed in blood cells is present in other tissues, in particular those derived from different germ layers. Therefore, we generated Illumina27K-based DNA methylation profiles for buccal cells obtained from 10 different individuals spanning an age range of 16–69 yr old (Supplemental Table 4). Buccal cells are ectodermal in origin whereas CD4+ and CD14+ are mesodermal. We confirmed that our buccal cell preparations contained very little, if any, leukocyte contamination, hence giving us confidence that the measured methylation profiles were predominantly from buccal cells (Supplemental Fig. 3). Hyper-aDMRs displayed statistically significant replication in buccal cells (P < 10−5, bootstrapped), suggesting that many of the hyper-aDMRs observed in CD4+ and CD14+ cells are multitissue hyper-aDMRs (Fig. 6). This conclusion is consistent with the observation that whole-blood hyper-aDMRs that replicated in CD4+ and CD14+ cells (i.e., the set of hyper-aDMRs used thus far for all the analyses in this study) also showed a relatively stronger aging-associated correlation (mean ρ = 0.26) in buccal cells compared with whole-blood hyper-aDMRs that did not replicate in CD4+ and CD14+ cells (mean ρ = 0.15) (P = 0.027, bootstrapped difference-of-means).
Figure 6.
Hyper-aDMRs replicate in buccal cells. For each probe with a significant positive aging-methylation correlation in the whole-blood data (P < 0.01), we calculated Spearman's ρ-values from the buccal data set. We split these into reproduced (correlation in the same direction in the CD4+ and CD14+ data sets) and nonreproduced data sets, and also show results for the complete set. We plot 50% and 95% credible intervals for the box-and-whisker plots on bootstrap estimates of the mean for each data set.
Recently, three small-scale studies (∼800 genes in each case) investigated human aging-related DNA methylation dynamics in a variety of relatively heterogeneous tissue types (Bjornsson et al. 2008; Boks et al. 2009; Christensen et al. 2009). We were unable to perform direct comparative analyses of aDMR lists from our study and the previous studies since only ∼0.5% of the CpGs on the Illumina27K arrays are represented on the arrays used in those previous studies. Nevertheless, we reanalyzed the data from one of these studies that examined aging in five different tissues (Christensen et al. 2009) and found that for three of these tissues—lung, head, and neck, and pleura—the identified hyper-aDMRs are enriched for ES-cell bivalent chromatin domain promoters (P ≤ 0.01 in each case, χ2-test). Although the authors also analyzed whole blood, we were unable to perform a suitable analysis since only six hyper-aDMRs were identified in whole blood in that study.
Discussion
Overall, our study identifies key properties of epigenetic dynamics during normal human aging. First, the replication of whole-blood hyper-aDMRs in CD4+ and CD14+ cells argues that these aDMRs cannot result simply from aging-associated changes in relative proportions of blood subsets. Rather, our findings are more consistent with a model in which hyper-aDMRs arise in precursor/stem cells prior to the divergence of the myeloid and lymphoid lineages. Furthermore, we demonstrate that hyper-aDMRs occur preferentially at a specific category of developmental gene promoters that bear a distinctive bivalent chromatin signature in precursor/stem cells, and are frequently hypermethylated in various cancers and cell culture. Also, our analysis of buccal cells, and data sets previously generated by others, suggests that the hyper-aDMR signature we describe here occurs in multiple tissues.
Aberrant DNA methylation at bivalent chromatin domain promoters in cell culture is associated with a decreased capacity to differentiate, but an increased ability to proliferate in vitro (Meissner et al. 2008). Similarly, in the context of human cancers, it has been proposed that aberrant hypermethylation at bivalent chromatin domain promoters leads to permanent silencing of genes required for differentiation, thereby pushing the stem cells into a state of perpetual self-renewal and predisposing to cancer development, i.e., the cancer stem cell hypothesis (Ohm and Baylin 2007). If similar outcomes are associated with hypermethylation at bivalent chromatin domains in precursor/stem cells in the context of aging, one would predict that aging is accompanied by a loss of developmental potency, but increased stem cell self-renewal. This has indeed recently been demonstrated in mice—HSCs from older individuals display increased stem cell self-renewal, but decreased efficiency to differentiate (Rossi et al. 2005). Given the well-established link between cancer incidence and old age, it is tempting to speculate that, at least in some instances, hyper-aDMRs at bivalent chromatin domains can act as one of the multiple “hits” required for cancer development in the elderly.
Methods
Sample information
Fresh venous blood samples were collected in heparinized vacutainer tubes and peripheral blood mononuclear cells (PBMCs) prepared by centrifugation over Ficoll-Hypaque gradients using standard procedures. CD4+ and CD14+ subsets were separated using magnetic bead-based positive selection system (Miltenyi Biotech). Genomic DNA was extracted using commercial kits (Qiagen). Buccal cells were obtained via mouth swabs and genomic DNA extracted using a commercial kit (Qiagen). Detailed information about the samples, and ethics approvals are provided in the Supplemental material.
Analysis of DNA methylation by Illumina27K arrays
The Illumina Infinium Human Methylation27 BeadChip assays DNA methylation levels at 27,578 different CpG sites. The DNA is first bisulfite converted, which results in unmethylated cytosines being converted to uracils, whereas methylated cytosines are not converted. The bisulfite-converted DNA is amplified, fragmented, and hybridized to the arrays. For each CpG site, methylation levels are measured by probes attached to beads, one each for unmethylated and methylated DNA, followed by allele-specific base extension that includes a fluorescent label. Different labels are used for the T (unmethylated) or C (methylated) alleles. Methylation scores for each CpG site are classified as “Beta” values (using BeadStudio 3.2 software from Illumina), that range from 0 (unmethylated) to 1 (fully methylated) on a continuous scale, and are based on the ratio of methylated-to-methylated + unmethylated signal outputs.
The samples were randomly arrayed in a 96-well plate, and bisulfite conversion was performed using Qiagen 96-well bisulfite conversion kits according to the manufacturer's instructions. After clean up, the samples were randomized again prior to hybridization to the Illumina27K arrays that were processed according to the manufacturer's instructions. We confirmed that each sample yielded a clear bimodal distribution of methylation Beta values, and discarded 3/96 whole-blood arrays where this was not the case. We also discarded any probes for which values were not reported by the BeadStudio software. Finally, we quantile-normalized within each of the three data sets (WB, CD4+, CD14+). We did not normalize across these data sets in case there were differences in overall methylation levels between the cell types.
Identification of aDMRs
For each of the three data sets, we calculated Spearman's rank correlation statistic (ρ) of methylation against age. The significance of each correlation was evaluated by permuting the sample → age map and recalculating the statistic. One possible confounding factor in the whole-blood data set is the presence of some twin pairs (14 MZ pairs, 17 DZ pairs). There are three factors that suggest these should not be a concern: (1) No family is represented more than twice out of a set of 93 samples, therefore any possible confounding effect will be small; (2) we confirmed our results on a smaller set with the second member of each twin pair excluded, and saw a very good correlation of P-values between smaller and larger sets—68/131 hyper-aDMRs are significant at P < 0.01 in the smaller data set and 115/131 at P < 0.05; (3) the aDMR sets we used in subsequent analyses were confirmed on the CD4+ and CD14+ data sets, with no twin pairs present. The whole-blood data set is exclusively female, and the CD4+ and CD14+ data sets are 80% female. Given our step-wise aDMR calling procedure, we have no power to call male-specific aDMRs, and diminished power to call female-specific aDMRs. However, our power to detect processes that are common to males and females are unaffected.
Estimation of FDRs
The empirical statistics used to discover aDMRs are expected to yield P-values uniformly distributed between 0 and 1 when applied to random data. Therefore, we expect that approximately 1% of CpGs will be incorrectly called as correlating with age at a threshold of P < 0.01. In fact, we observed a considerable excess of low P-values (greater than twofold for hyper-aDMRs, slightly less for hypo-aDMRs), and made initial estimates of FDR by taking the inverse of the fold excess. This yielded estimates of 41% for hyper-aDMRs and 70% for hypo-aDMRs. However, we then confirmed aDMRs by checking for a matching age/methylation trend in the CD4+ and CD14+ samples. In the case that our aDMRs are artifactual, ∼50% of the calls would fail the first of these tests (since there should be no correlation between the two data sets). Therefore, we halved our estimates resulting in the final FDRs quoted in the main text. The true FDRs are actually lower since we required a match in both CD4+ and CD14+. However, since these samples came substantially from the same individuals, we might expect to see at least some degree of correlation due to factors other than age. We therefore take a conservative approach in our FDR estimations.
Processing of ChIP-seq data
ChIP-seq data were downloaded from http://dir.nhlbi.nih.gov/papers/lmi/epigenomes/hgtcell.aspx and http://dir.nhlbi.nih.gov/papers/lmi/epigenomes/hghscmethylation.aspx. We used tag-depth statistics as provided for those data sets. When performing CpG-centric comparisons of methylation and ChIP data, we considered the maximum tag depth within 200 bp of the location of genomic location of the methylation array probe sequence.
Statistical methods
Except where a standard test statistic is specified, all statistics were generated empirically by shuffling or bootstrapping the data as appropriate. Error bars represent empirically calculated 95% credible intervals on our estimates unless otherwise stated.
Acknowledgments
The study was funded by the Wellcome Trust, EU FP7 ENGAGE project HEALTH-F4-2007-201413 (T.S.), Department of Health via the National Institute for Health Research (NIHR) comprehensive Biomedical Research Centre award to Guy's & St Thomas' NHS Foundation Trust in partnership with King's College London (T.S.), and the Juvenille Diabetes Research Foundation (R.D.L., V.K.R., and H.B.). T.D.S. is an NIHR senior investigator. V.K.R. received support from the Barts and The London Charity. T.D. is supported by a Wellcome Trust Research Career Development Fellowship (083563). R.D.G.L. and H.B. received support from the British Diabetic Twin Trust. P.W., O.T.M., and P.D. are supported by the Wellcome Trust. S.F. is supported by the MRC. We thank Keji Zhao and Chongzhi Zhang for providing the list of chromatin modifications observed in HSCs.
Footnotes
[Supplemental material is available online at http://www.genome.org. The microarray data from this study have been submitted to the NCBI Gene Expression Omnibus (http://www.ncbi.nlm.nih.gov/geo/) under accession nos. GSE20236 and GSE20242.]
Article published online before print. Article and publication date are at http://www.genome.org/cgi/doi/10.1101/gr.103101.109.
References
- Azuara V, Perry P, Sauer S, Spivakov M, Jørgensen HF, John RM, Gouti M, Casanova M, Warnes G, Merkenschlager M, et al. Chromatin signatures of pluripotent cell lines. Nat Cell Biol. 2006;8:532–538. doi: 10.1038/ncb1403. [DOI] [PubMed] [Google Scholar]
- Barski A, Cuddapah S, Cui K, Roh TY, Schones DE, Wang Z, Wei G, Chepelev I, Zhao K. High-resolution profiling of histone methylations in the human genome. Cell. 2007;129:823–837. doi: 10.1016/j.cell.2007.05.009. [DOI] [PubMed] [Google Scholar]
- Bernstein BE, Mikkelsen TS, Xie X, Kamal M, Huebert DJ, Cuff J, Fry B, Meissner A, Wernig M, Plath K, et al. A bivalent chromatin structure marks key developmental genes in embryonic stem cells. Cell. 2006;125:315–326. doi: 10.1016/j.cell.2006.02.041. [DOI] [PubMed] [Google Scholar]
- Bibikova M, Le J, Barnes R, Saedinia-Melnyk S, Zhou L, Shen R, Gunderson KL. Genome-wide DNA methylation profiling using Infinium® assay. Epigenomics. 2009;1:177–200. doi: 10.2217/epi.09.14. [DOI] [PubMed] [Google Scholar]
- Bjornsson HT, Sigurdsson MI, Fallin MD, Irizarry RA, Aspelund T, Cui H, Yu W, Rongione MA, Ekström TJ, Harris TB, et al. Intra-individual change over time in DNA methylation with familial clustering. JAMA. 2008;299:2877–2883. doi: 10.1001/jama.299.24.2877. [DOI] [PMC free article] [PubMed] [Google Scholar]
- Boks MP, Derks EM, Weisenberger DJ, Strengman E, Janson E, Sommer IE, Kahn RS, Ophoff RA. The relationship of DNA methylation with age, gender and genotype in twins and healthy controls. PLoS One. 2009;4:e6767. doi: 10.1371/journal.pone.0006767. [DOI] [PMC free article] [PubMed] [Google Scholar]
- Christensen BC, Houseman EA, Marsit CJ, Zheng S, Wrensch MR, Wiemels JL, Nelson HH, Karagas MR, Padbury JF, Bueno R, et al. Aging and environmental exposures alter tissue-specific DNA methylation dependent upon CpG island context. PLoS Genet. 2009;5:e1000602. doi: 10.1371/journal.pgen.1000602. [DOI] [PMC free article] [PubMed] [Google Scholar]
- Cui K, Zang C, Roh TY, Schones DE, Childs RW, Peng W, Zhao K. Chromatin signatures in multipotent human hematopoietic stem cells indicate the fate of bivalent genes during differentiation. Cell Stem Cell. 2009;4:80–93. doi: 10.1016/j.stem.2008.11.011. [DOI] [PMC free article] [PubMed] [Google Scholar]
- Dorus S, Vallender EJ, Evans PD, Anderson JR, Gilbert SL, Mahowald M, Wyckoff GJ, Malcom CM, Lahn BT. Accelerated evolution of nervous system genes in the origin of Homo sapiens. Cell. 2004;119:1027–1040. doi: 10.1016/j.cell.2004.11.040. [DOI] [PubMed] [Google Scholar]
- Eisenberg E, Levanon EY. Human housekeeping genes are compact. Trends Genet. 2003;19:362–365. doi: 10.1016/S0168-9525(03)00140-9. [DOI] [PubMed] [Google Scholar]
- Figueroa ME, Skrabanek L, Li Y, Jiemjit A, Fandy TE, Paietta E, Fernandez H, Tallman MS, Greally JM, Carraway H, et al. MDS and secondary AML display unique patterns and abundance of aberrant DNA methylation. Blood. 2009;114:3448–3458. doi: 10.1182/blood-2009-01-200519. [DOI] [PMC free article] [PubMed] [Google Scholar]
- Fraga MF, Ballestar E, Paz MF, Ropero S, Setien F, Ballestar ML, Heine-Suñer D, Cigudosa JC, Urioste M, Benitez J, et al. Epigenetic differences arise during the lifetime of monozygotic twins. Proc Natl Acad Sci. 2005;102:10604–10609. doi: 10.1073/pnas.0500398102. [DOI] [PMC free article] [PubMed] [Google Scholar]
- Meissner A, Mikkelsen TS, Gu H, Wernig M, Hanna J, Sivachenko A, Zhang X, Bernstein BE, Nusbaum C, Jaffe DB, et al. Genome-scale DNA methylation maps of pluripotent and differentiated cells. Nature. 2008;454:766–770. doi: 10.1038/nature07107. [DOI] [PMC free article] [PubMed] [Google Scholar]
- Ohm JE, Baylin SB. Stem cell chromatin patterns: An instructive mechanism for DNA hypermethylation? Cell Cycle. 2007;6:1040–1043. doi: 10.4161/cc.6.9.4210. [DOI] [PMC free article] [PubMed] [Google Scholar]
- Ohm JE, McGarvey KM, Yu X, Cheng L, Schuebel KE, Cope L, Mohammad HP, Chen W, Daniel VC, Yu W, et al. A stem cell-like chromatin pattern may predispose tumor suppressor genes to DNA hypermethylation and heritable silencing. Nat Genet. 2007;39:237–242. doi: 10.1038/ng1972. [DOI] [PMC free article] [PubMed] [Google Scholar]
- Rossi DJ, Bryder D, Zahn JM, Ahlenius H, Sonu R, Wagers AJ, Weissman IL. Cell intrinsic alterations underlie hematopoietic stem cell aging. Proc Natl Acad Sci. 2005;102:9194–9199. doi: 10.1073/pnas.0503280102. [DOI] [PMC free article] [PubMed] [Google Scholar]
- Schlesinger Y, Straussman R, Keshet I, Farkash S, Hecht M, Zimmerman J, Eden E, Yakhini Z, Ben-Shushan E, Reubinoff BE, et al. Polycomb-mediated methylation on Lys27 of histone H3 pre-marks genes for de novo methylation in cancer. Nat Genet. 2007;39:232–236. doi: 10.1038/ng1950. [DOI] [PubMed] [Google Scholar]
- Vijg J, Campisi J. Puzzles, promises and a cure for ageing. Nature. 2008;454:1065–1071. doi: 10.1038/nature07216. [DOI] [PMC free article] [PubMed] [Google Scholar]
- Widschwendter M, Fiegl H, Egle D, Mueller-Holzner E, Spizzo G, Marth C, Weisenberger DJ, Campan M, Young J, Jacobs I, et al. Epigenetic stem cell signature in cancer. Nat Genet. 2007;39:157–158. doi: 10.1038/ng1941. [DOI] [PubMed] [Google Scholar]
- Zhao XD, Han X, Chew JL, Liu J, Chiu KP, Choo A, Orlov YL, Sung WK, Shahab A, Kuznetsov VA, et al. Whole-genome mapping of histone H3 Lys4 and 27 trimethylations reveals distinct genomic compartments in human embryonic stem cells. Cell Stem Cell. 2007;1:286–298. doi: 10.1016/j.stem.2007.08.004. [DOI] [PubMed] [Google Scholar]


