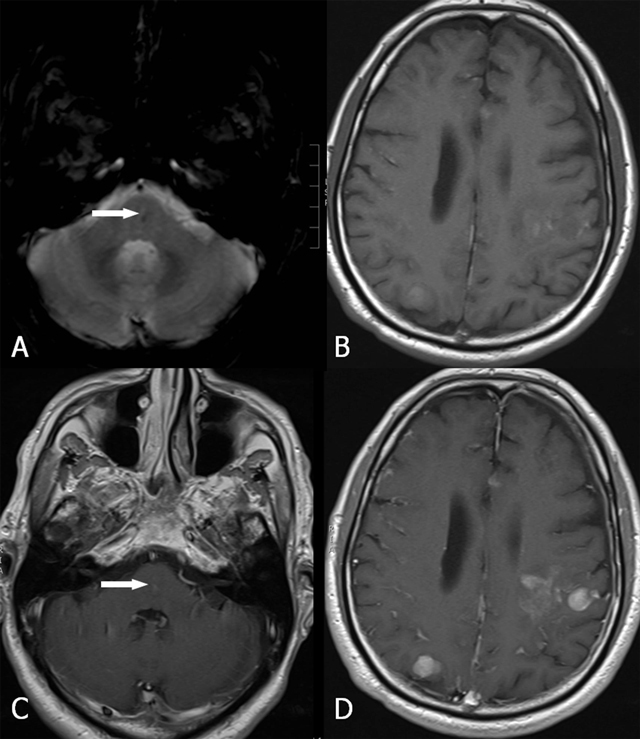
Figure 14.

Hemorrhagic metastases. GRE-T2*(A), SE T1-WI (B), and SE T1-WI (C, D) after contrast. Small focus of low signal (A) in the pons (arrow) with faint contrast enhancement (C) (arrow). Presence of multiple, supratentorial, nodular hemorrhagic (B), and enhancing lesions (D).
