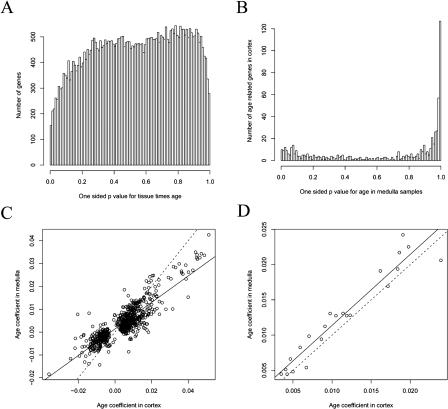
Figure 2. Similar Age-Regulation in Cortex and Medulla.
(A) For every gene, we calculated a p˜ -value that there is a Tissuei ×Agei effect, and plotted the results in a histogram. Genes that show different age regulation in the cortex or the medulla would be contained in peaks on the left and right parts of the histogram. The figure shows that the number of genes that have different expression levels in the cortex and medulla is about the same as or less than would be expected by chance. The x-axis shows one-sided p˜ -values for Tissuei ×Agei, and the y-axis shows the number of genes with that p˜ -value. There is a systematic under-representation of the edge regions compared to a random sample of uniform random variables because of correlations among the 44,928 p˜ -values computed from 133 samples.
(B) To show whether aging in the cortex and the medulla is similar, we selected age-regulated genes in the cortex and calculated the one-tailed p˜ -value for age effects in the medulla. The histogram shows these selected p˜ -values. The spike at the right shows genes that increase with age in the medulla. Those genes also increased with age in the cortex.
(C) Shown is a scatterplot of all 684 genes that are age-regulated in either the medulla or the cortex (p < 0.001). The y-axis is the slope for the medulla of the expression change with respect to age, and the x-axis is the slope for the cortex. The solid line is the least squares line, with a slope of 0.58. The dotted line has a slope of one and passes through the origin.
(D) Same as (C) but for 22 genes that are age-regulated in both the cortex and the medulla (p < 0.001).

