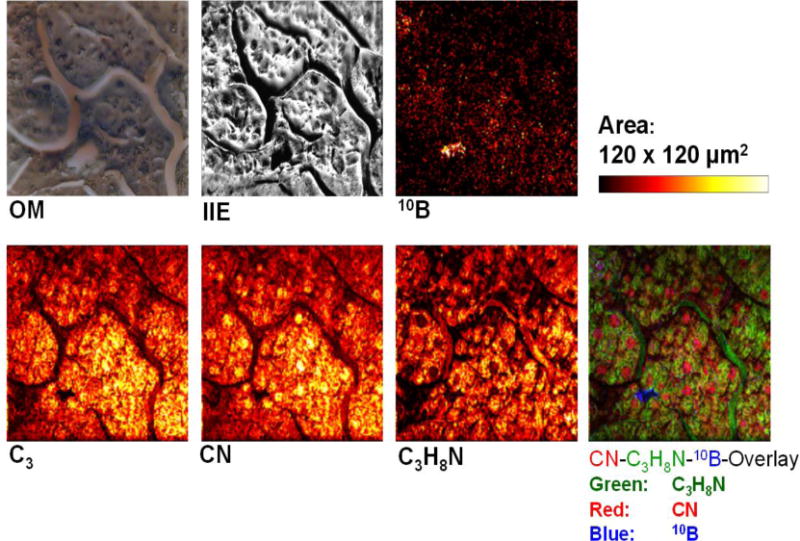
Figure 6.

Optical Microscopy (OM), ion induced electron (IIE) and boron distribution (10B) detected by laser SNMS are shown in the upper row. In the bottom row intents signals from molecules like C3, CN and C3H8N are observed, representing lipids, proteins and nucleic acids. Samples were taken from a kidney of a NMRI nude mouse and treated with a combination of sodium mercaptoundecahydro-closododecaborate (BSH) and p-boronophenylelanine (BPA). Reprinted with permission from Elsevier.[81]
