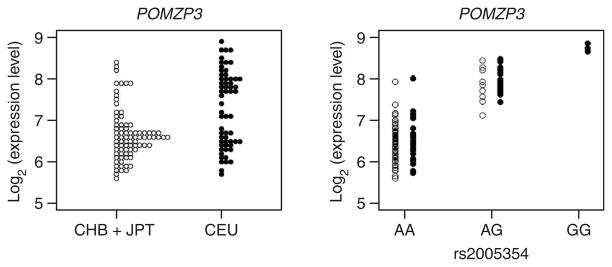
Figure 3.
The population difference in expression of POMZP3 is accounted for by the allele frequency difference at the very closely linked SNP rs2005354. The left panel shows the distribution of expression level in the same format as in Figure 1. The right panel shows the expression level separately for individuals with each genotype of the SNP.

