More than 50 years ago, Congress established Title I, Part A funding (generally just called Title I) to support school districts in educating the nation’s economically disadvantaged students. Today, billions of dollars in Title I funding are distributed to school districts across the country through four grants, using a complex set of formulas.
A new report from the National Center for Education Statistics (NCES) provides a look at how Title I funds are allocated and how the current formulas affect school districts of various sizes, socioeconomic status, and geographic locales, such as rural or urban. The Study of the Title I, Part A Grant Program Mathematical Formulas was conducted in response to a congressional mandate under the Every Student Succeeds Act (ESSA), which was passed in 2015.
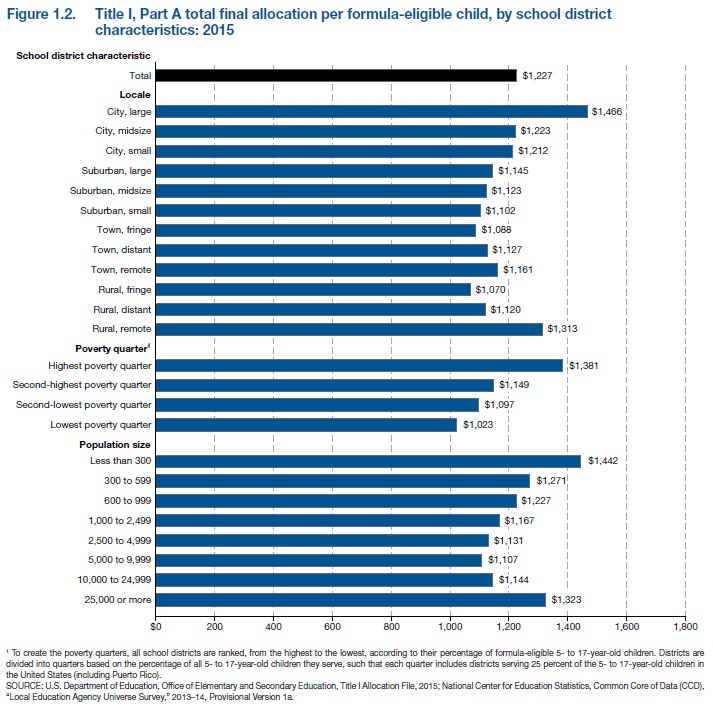
In fiscal year 2015 (FY 15), the total Title I allocation per formula-eligible child in the United States was $1,227.[1],[2] However, states varied in their total Title I final allocation per formula-eligible child, ranging from $984 in Idaho to $2,590 in Vermont, a difference of $1,606. (NOTE: A child is "formula eligible" if he or she is ages 5–17 and living in a family below the national poverty level or one that is receiving Temporary Assistance for Needy Families [TANF], a neglected and delinquent child located in a locally funded institution, or a foster child.)
Total Title I allocations per formula-eligible child also differed by geographic locale, district poverty level, and district size:
- The locales with the highest total Title I final allocations were the most densely and least densely populated areas: large cities ($1,466) and remote rural areas ($1,313);
- The poorest districts (i.e., those in the highest poverty quarter) had the highest total Title I allocations ($1,381), and the least-poor districts (i.e., those in the lowest poverty quarter) had the lowest total Title I allocations ($1,023); and
- The smallest districts (those with a 5- to 17-year-old population of less than 300) had the highest total Title I final allocation ($1,442) compared with districts of all other population sizes. The largest districts (those with a population of 25,000 or more) had the second-highest allocation ($1,323). The allocation was lowest ($1,107) for districts with a population of 5,000 to 9,999.

Because each of the federal allocation formulas use a series of provisions, there is not a direct link between the percentage of formula-eligible children in a district or state and the percentage of federal funds allocated to that district or state. It is also important to note that there is no direct link between the formula-eligible children upon whom the distribution of funds is based and the children who receive services from Title I. Today, 95 percent of children served by Title I receive services in schoolwide programs that serve all children in the school, regardless of whether they are formula eligible or not. Altogether, about 11.6 million children are counted as formula eligible in the United States, but more than twice that amount (about 25 million students) receive Title I services.
The 250-page report includes a number of other findings, including
- An overview of the Title I funding formula process;
- Detailed analyses for each of the grant programs (Basic, Concentration, Targeted, and Education Finance Incentive Grants);
- Alternative analyses that isolate components of each grant program;
- American Community Survey-Comparable Wage Index (CWI) adjusted allocations; and
- A table of Title I, Part A total allocations by grant type and school district.
To access the full report, please visit the NCES website at https://nces.ed.gov/pubs2019/titlei/.
By Tom Snyder and Rachel Dinkes
[1] The analytic metric used in the report is the amount of funding allocated for the designated Title I grant divided by the number of formula-eligible children used in the computation for that specific grant.
[2] Detailed information on the Title I formula grant process and the components of the mathematical formulas can be found in the report’s introduction.
While many NCES reports and products compare data between racial and ethnic groups, it is important to remember that outcomes can also differ substantially for individuals within these individual groups. The National Indian Education Study (NIES), part of the National Assessment of Education Progress (NAEP), is one way that NCES tries to look at the diverse experiences of a particular group of students.
One of the primary goals of NIES is to collect and report data for subgroups of American Indian and Alaska Native (AI/AN) students. NCES released an initial report on the results of the 2015 NIES in early 2017 that focused on differences across three mutually exclusive school types:
- Low density public schools (where less than 25 percent of all students in the school were AI/AN)
- High density public schools (where 25 percent or more of all the students in the school were AI/AN)
- Bureau of Indian Education schools
A recently released follow up report, National Indian Education Study 2015: A Closer Look builds on the findings of the first report and focuses, in part, on NAEP 2015 assessment differences within the AI/AN student group. Although NIES provides a large enough sample size to facilitate comparisons among groups of AI/AN students, it is important to note that AI/AN students are diverse linguistically, culturally, geographically, economically, and in many other ways. By focusing specifically on this student group, NCES is able to highlight the educational experiences and related academic outcomes of these students.

National Indian Education Study 2015: A Closer Look reveals some significant differences when comparing AI/AN students performing at or above the 75th percentile (referred to in the report as “higher-performing”) with those performing below the 25th percentile (referred to as “lower-performing”). For example, higher-performing students in both mathematics and reading and in both grades 4 and 8 were more likely to have:
- A school library, media center, or resource center that contained materials about AI/AN people,
- More than 25 books in their homes, and
- A computer at home that they use.
A Technical Review Panel of American Indian and Alaska Native educators and researchers from across the country provides guidance on the study. Their expertise helps to ensure that this report will provide valuable, and much needed information to AI/AN educational stakeholders. In addition, whereas most other NCES reports are now electronic-only, hard copies of the NIES report are also produced in support of making them available for those AI/AN educational stakeholders who may not have easy access to the internet. This report is also unique in that the Technical Review Panel issued a statement highlighting the importance of this study and providing a brief overview of the overall context of AI/AN education, which may be helpful to readers as they read the report. This statement is available online at https://www2.ed.gov/about/offices/list/oese/resources.html.
By Jamie Deaton