- Introduction
Here's a quick start using Play-With-Docker (PWD) to start-up a Prometheus stack containing Prometheus, Grafana and Node scraper to monitor your Docker infrastructure. The Try in PWD below allows you to quickly deploy the entire Prometheus stack with a click of the button. This will allow you to quickly test the stack to see if it meets your needs.
Before we get started installing the Prometheus stack. Ensure you install the latest version of docker and docker swarm on your Docker host machine. Docker Swarm is installed automatically when using Docker for Mac or Docker for Windows.
Clone the project locally to your Docker host.
If you would like to change which targets should be monitored or make configuration changes edit the /prometheus/prometheus.yml file. The targets section is where you define what should be monitored by Prometheus. The names defined in this file are actually sourced from the service name in the docker-compose file. If you wish to change names of the services you can add the "container_name" parameter in the docker-compose.yml file.
Once configurations are done let's start it up. From the /prometheus project directory run the following command:
$ HOSTNAME=$(hostname) docker stack deploy -c docker-stack.yml prom
That's it the `docker stack deploy' command deploys the entire Grafana and Prometheus stack automagically to the Docker Swarm. By default cAdvisor and node-exporter are set to Global deployment which means they will propogate to every docker host attached to the Swarm.
The Grafana Dashboard is now accessible via: http://<Host IP Address>:3000 for example http://192.168.10.1:3000
username - admin
password - foobar (Password is stored in the `/grafana/config.monitoring` env file)
In order to check the status of the newly created stack:
$ docker stack ps prom
View running services:
$ docker service ls
View logs for a specific service
$ docker service logs prom_<service_name>
Grafana version 5.0.0 has introduced the concept of provisioning. This allows us to automate the process of adding Datasources & Dashboards. The /grafana/provisioning/ directory contains the datasources and dashboards directories. These directories contain YAML files which allow us to specify which datasource or dashboards should be installed.
If you would like to automate the installation of additional dashboards just copy the Dashboard JSON file to /grafana/provisioning/dashboards and it will be provisioned next time you stop and start Grafana.
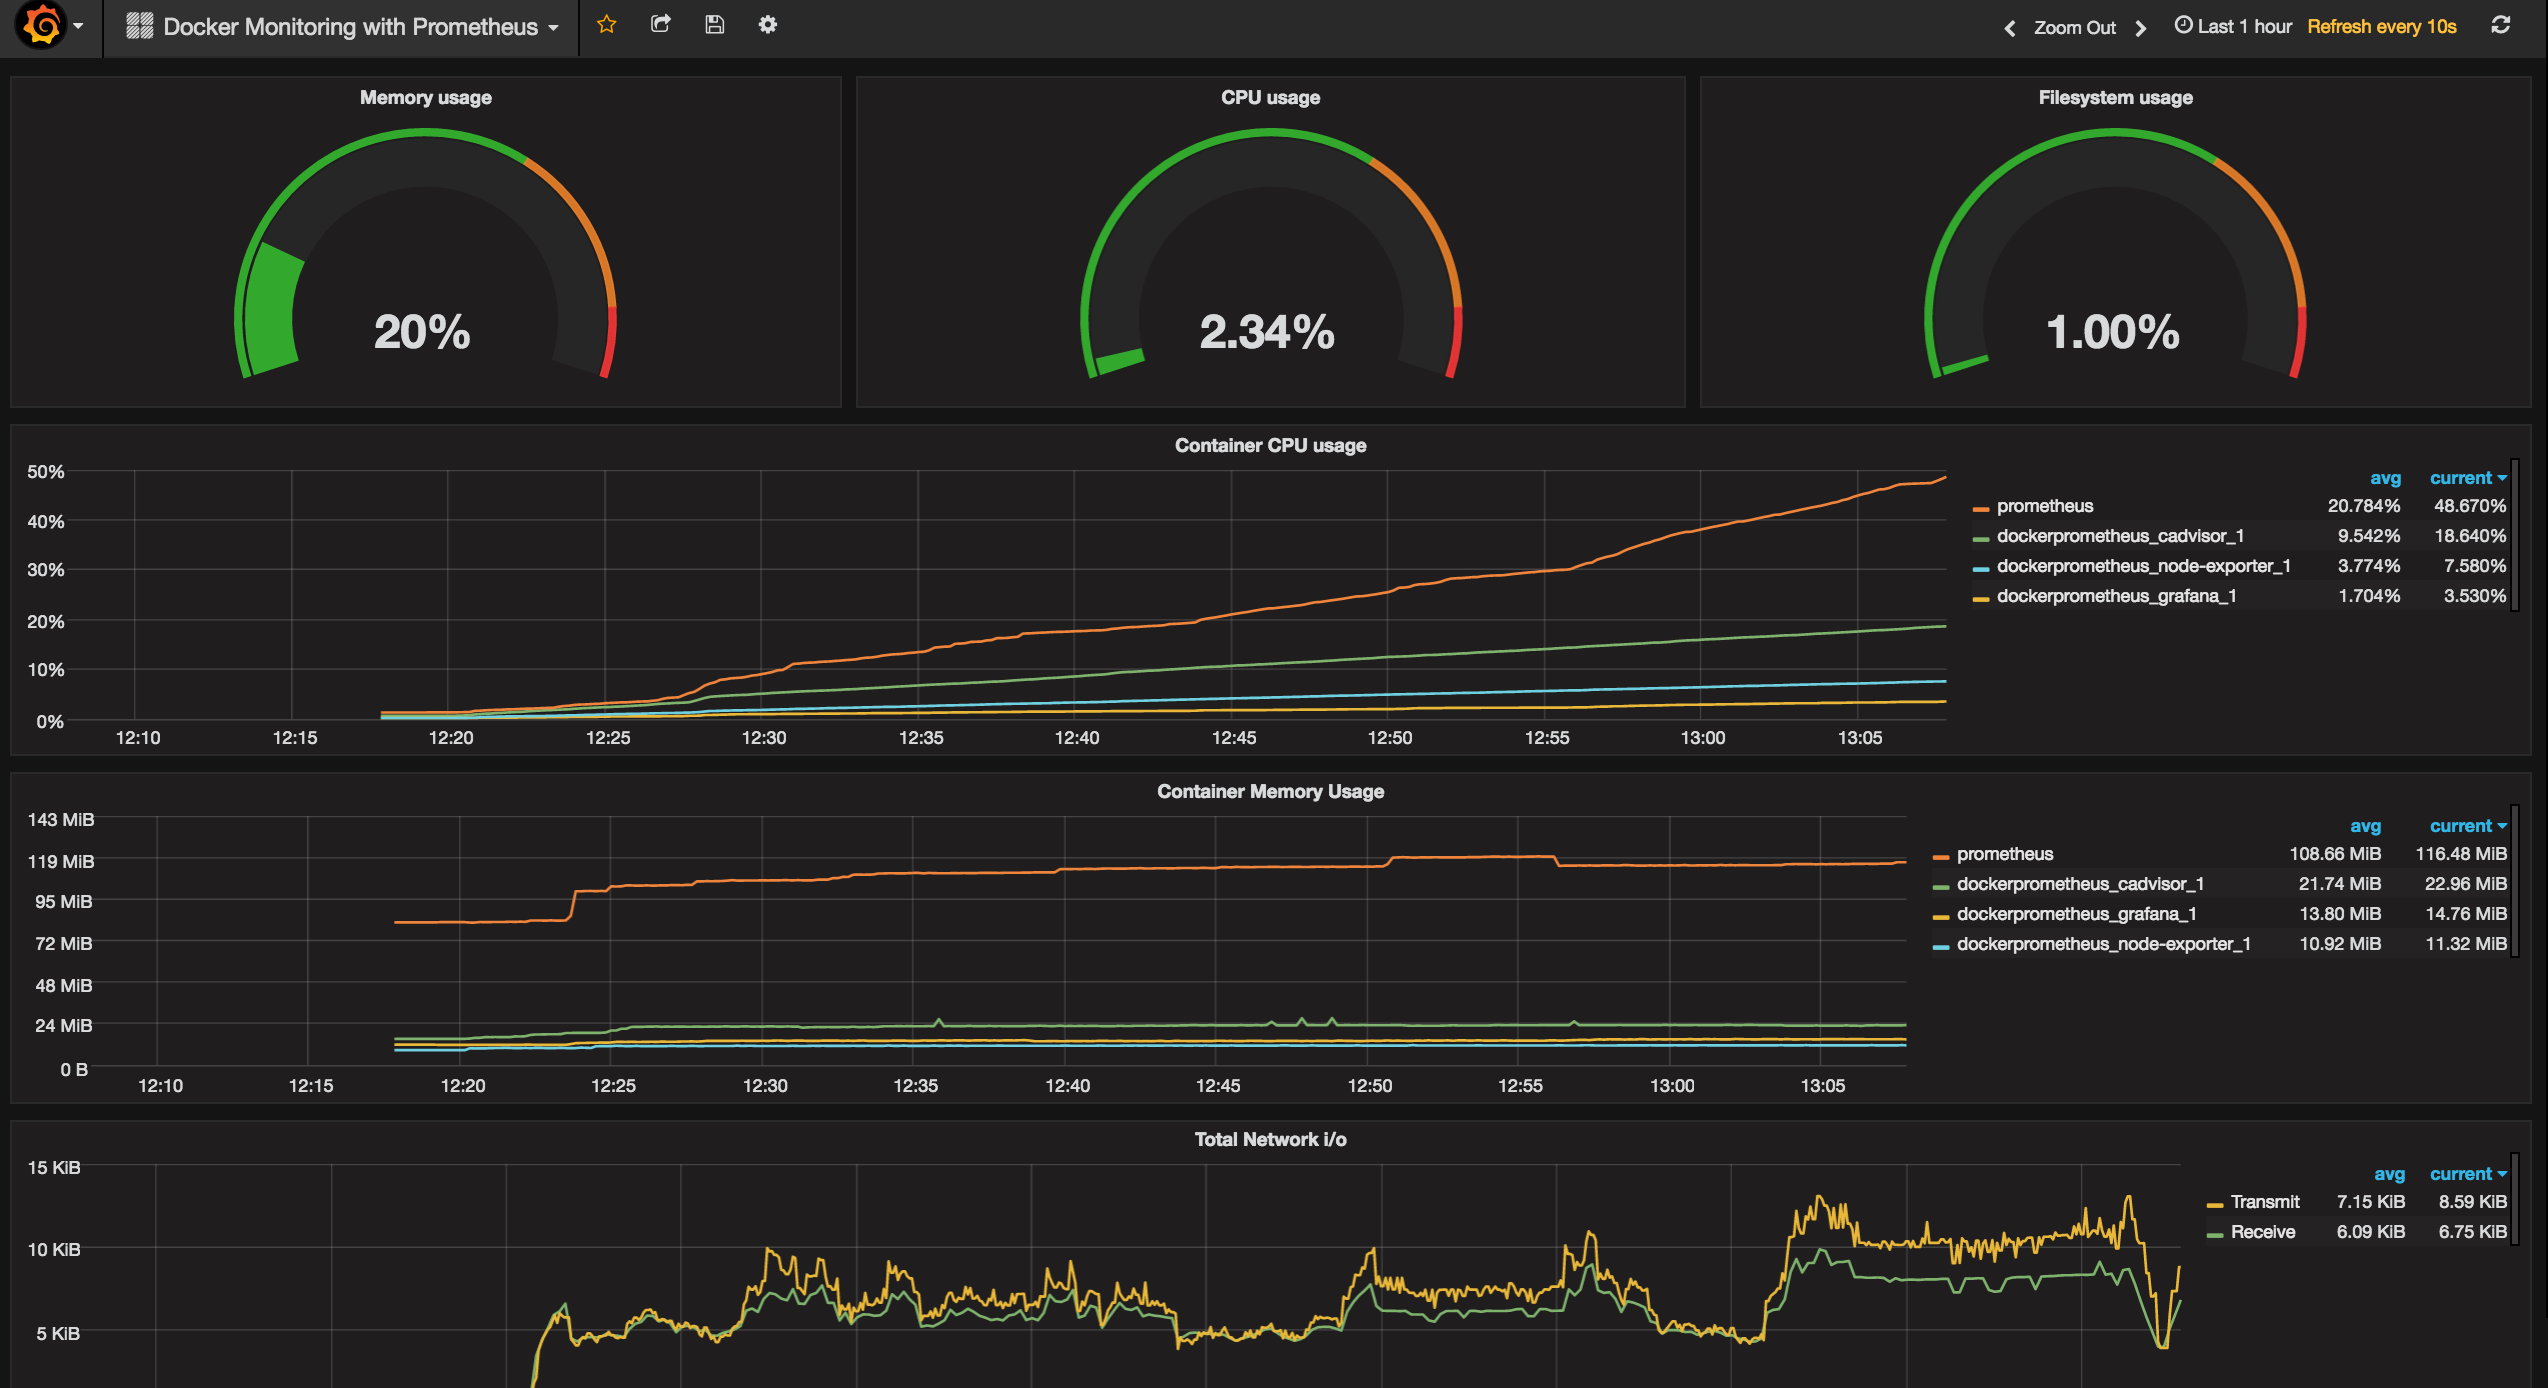
I created a Dashboard template which is available on Grafana Docker Dashboard. Simply select Import from the Grafana menu -> Dashboards -> Import and provide the Dashboard ID #179
This dashboard is intended to help you get started with monitoring. If you have any changes you would like to see in the Dashboard let me know so I can update Grafana site as well.
Here's the Dashboard Template
Grafana Dashboard - dashboards/Grana_Dashboad.json
Alerting Dashboard
Alerting has been added to the stack with Slack integration. 2 Alerts have been added and are managed
Alerts - prometheus/alert.rules
Slack configuration - alertmanager/config.yml
The Slack configuration requires to build a custom integration.
- Open your slack team in your browser
https://<your-slack-team>.slack.com/apps - Click build in the upper right corner
- Choose Incoming Web Hooks link under Send Messages
- Click on the "incoming webhook integration" link
- Select which channel
- Click on Add Incoming WebHooks integration
- Copy the Webhook URL into the
alertmanager/config.ymlURL section - Fill in Slack username and channel
View Prometheus alerts http://<Host IP Address>:9090/alerts
View Alert Manager http://<Host IP Address>:9093
A quick test for your alerts is to stop a service. Stop the node_exporter container and you should notice shortly the alert arrive in Slack. Also check the alerts in both the Alert Manager and Prometheus Alerts just to understand how they flow through the system.
High load test alert - docker run --rm -it busybox sh -c "while true; do :; done"
Let this run for a few minutes and you will notice the load alert appear. Then Ctrl+C to stop this container.
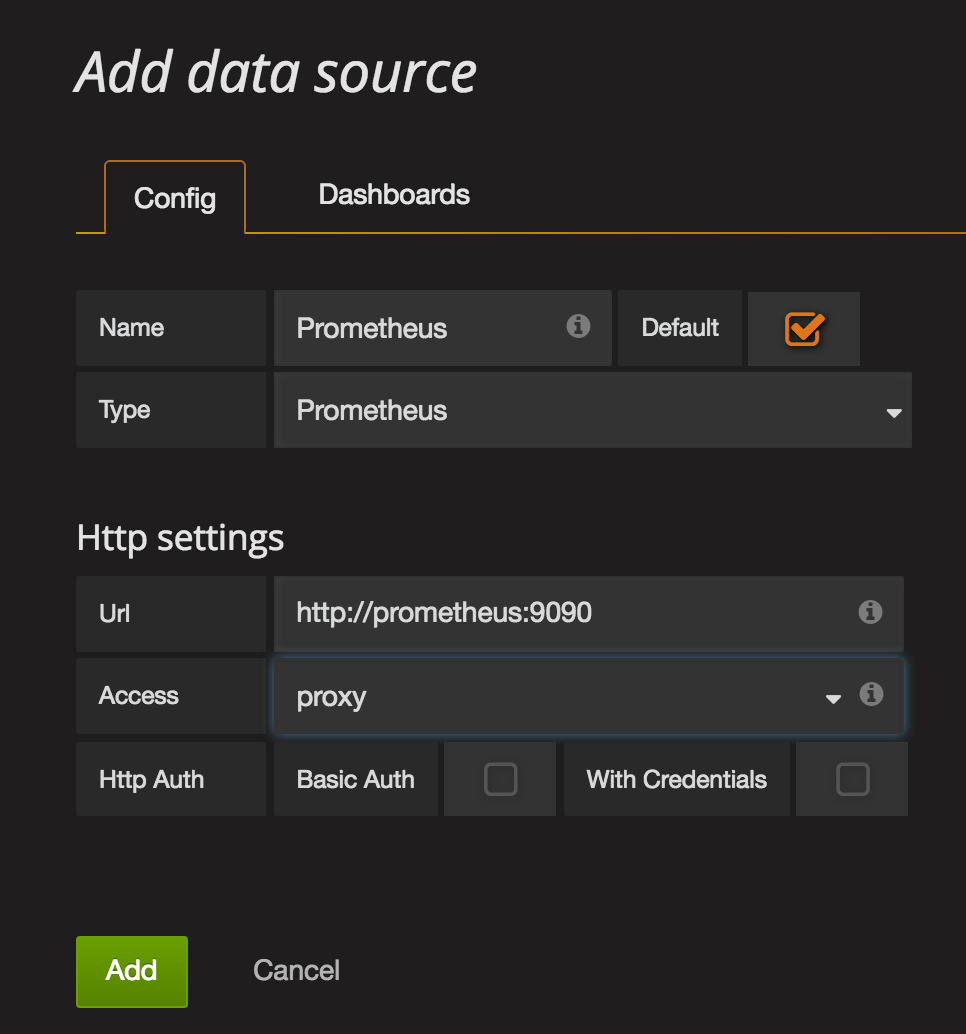
Now we need to create the Prometheus Datasource in order to connect Grafana to Prometheus
- Click the
GrafanaMenu at the top left corner (looks like a fireball) - Click
Data Sources - Click the green button
Add Data Source.
Ensure the Datasource name Prometheusis using uppercase P
This project is intended to be a quick-start to get up and running with Docker and Prometheus. Security has not been implemented in this project. It is the users responsability to implement Firewall/IpTables and SSL.
Since this is a template to get started Prometheus and Alerting services are exposing their ports to allow for easy troubleshooting and understanding of how the stack works.
Same requirements as above. Swarm should be enabled and the Repo should be cloned to your Docker host.
In the docker-traefik-prometheusdirectory run the following:
docker stack deploy -c docker-traefik-stack.yml traefik
Verify all the services have been provisioned. The Replica count for each service should be 1/1 Note this can take a couple minutes
docker service ls
- Grafana - http://grafana.localhost
- Prometheus - http://prometheus.localhost
Once all the services are up we can open the Traefik Dashboard. The dashboard should show us our frontend and backends configured for both Grafana and Prometheus.
http://localhost:8080
Take a look at the metrics which Traefik is now producing in Prometheus metrics format
http://localhost:8080/metrics
Grafana is an Open Source visualization tool for the metrics collected with Prometheus. Next, open Grafana to view the Traefik Dashboards. Note: Firefox doesn't properly work with the below URLS please use Chrome
http://grafana.localhost
Username: admin Password: foobar
Open the Traefik Dashboard and select the different backends available
Note: Upper right-hand corner of Grafana switch the default 1 hour time range down to 5 minutes. Refresh a couple times and you should see data start flowing
Here are just a couple security considerations for this stack to help you get started.
- Remove the published ports from Prometheus and Alerting servicesi and only allow Grafana to be accessed
- Enable SSL for Grafana with a Proxy such as jwilder/nginx-proxy or Traefik with Let's Encrypt
- Add user authentication via a Reverse Proxy jwilder/nginx-proxy or Traefik for services cAdvisor, Prometheus, & Alerting as they don't support user authenticaiton
- Terminate all services/containers via HTTPS/SSL/TLS
It appears some people have reported no data appearing in Grafana. If this is happening to you be sure to check the time range being queried within Grafana to ensure it is using Today's date with current time.
-
The node-exporter does not run the same as Mac and Linux. Node-Exporter is not designed to run on Mac and in fact cannot collect metrics from the Mac OS due to the differences between Mac and Linux OS's. I recommend you comment out the node-exporter section in the
docker-compose.ymlfile and instead just use the cAdvisor. -
If you find after you deploy your project that the prometheus and alertmanager services are in pending status due to "no suitable node" this is due to file system permissions. Be sure to Open Docker for Mac Preferences -> File Sharing Menu and add the following:
Several projects utilize this Prometheus stack. Here's the list of projects:
- Docker Pulls - Visualize Docker-Hub pull statistics with Prometheus
- GitHub Monitoring - Monitor your GitHub projects with Prometheus
- Traefik Reverse Proxy/Load Balancer Monitoring - Monitor the popular Reverse Proxy/Load Balancer Traefik with Prometheus
- internet monitoring - Monitor your local network, internet connection and speed with Prometheus.
- Dockerize Your Dev - Docker compose a VM to get LetsEncrypt / NGINX proxy auto provisioning, ELK logging, Prometheus / Grafana monitoring, Portainer GUI, and more...
Have an interesting Project which uses this Repo? Submit yours to the list


