. 2020 Jun 16:13:1178633720930711.
doi: 10.1177/1178633720930711. eCollection 2020.

NeoCoV Is Closer to MERS-CoV than SARS-CoV

Affiliations

NeoCoV Is Closer to MERS-CoV than SARS-CoV

Mohamed M Hassan et al. Infect Dis (Auckl). .

Abstract

Recently, Coronavirus has been given considerable attention from the biomedical community based on the emergence and isolation of a deadly coronavirus infecting human. To understand the behavior of the newly emerging MERS-CoV requires knowledge at different levels (epidemiologic, antigenic, and pathogenic), and this knowledge can be generated from the most related viruses. In this study, we aimed to compare between 3 species of Coronavirus, namely Middle East Respiratory Syndrome (MERS-CoV), Severe Acute Respiratory Syndrome (SARS-CoV), and NeoCoV regarding whole genomes and 6 similar proteins (E, M, N, S, ORF1a, and ORF1ab) using different bioinformatics tools to provide a better understanding of the relationship between the 3 viruses at the nucleotide and amino acids levels. All sequences have been retrieved from National Center for Biotechnology Information (NCBI). Regards to target genomes' phylogenetic analysis showed that MERS and SARS-CoVs were closer to each other compared with NeoCoV, and the last has the longest relative time. We found that all phylogenetic methods in addition to all parameters (physical and chemical properties of amino acids such as the number of amino acid, molecular weight, atomic composition, theoretical pI, and structural formula) indicated that NeoCoV proteins were the most related to MERS-CoV one. All phylogenetic trees (by both maximum-likelihood and neighbor-joining methods) indicated that NeoCoV proteins have less evolutionary changes except for ORF1a by just maximum-likelihood method. Our results indicated high similarity between viral structural proteins which are responsible for viral infectivity; therefore, we expect that NeoCoV sooner may appear in human-related infection.

Keywords: 6 proteins; MERS-CoV; NeoCoV; SARS-CoV; bioinformatics analysis; coronaviruses; evolutionary study.


Conflict of interest statement

Declaration of conflicting interests:The author(s) declared no potential conflicts of interest with respect to the research, authorship, and/or publication of this article.

Figures

Figure 1.
Figure 1.
Global pairwise alignment results by Needleman-Wunsch method.
Figure 2.
Figure 2.
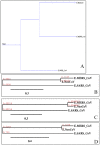
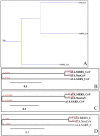
Phylogenetic trees comparing whole genomes of coronavirus species MERS-CoV, SARS-CoV, and NeoCoV, and trees “A-D” were built using different methods. (A) The evolutionary history was inferred using the Maximum Parsimony (MP) method. The most parsimonious tree with length = 42 663 is shown. The consistency index is 0.980475 (0.613278), the retention index is 0.369417 (0.369417), and the composite index is 0.362204 (0.226555) for all sites and parsimony-informative sites (in parentheses). The MP tree was obtained using the Subtree-Pruning-Regrafting (SPR) algorithm(p126) with search level 0 in which the initial trees were obtained by the random addition of sequences (10 replicates). The analysis involved 4 nucleotide sequences. There were a total of 29 693 positions in the final dataset. (B) The evolutionary history was inferred using the Neighbor-Joining method. The optimal tree with the sum of branch length = 18.91227594 is shown. The tree is drawn to scale, with branch lengths in the same units as those of the evolutionary distances used to infer the phylogenetic tree. The evolutionary distances were computed using the Maximum Composite Likelihood method and are in the units of the number of base substitutions per site. The analysis involved three nucleotide sequences. All positions containing gaps and missing data were eliminated. There were a total of 29 690 positions in the final dataset. (C) The evolutionary history was inferred using the UPGMA method. The optimal tree with the sum of branch length = 18.91227594 is shown. The tree is drawn to scale, with branch lengths in the same units as those of the evolutionary distances used to infer the phylogenetic tree. The evolutionary distances were computed using the Maximum Composite Likelihood method and are in the units of the number of base substitutions per site. The analysis involved 3 nucleotide sequences. All positions containing gaps and missing data were eliminated. There were a total of 29 690 positions in the final dataset. (D) The evolutionary history was inferred by using the Maximum-Likelihood method based on the Tamura-Nei model. The tree with the highest log likelihood (−121 024.68) is shown. Initial tree(s) for the heuristic search were obtained automatically by applying Neighbor-Join and BioNJ algorithms to a matrix of pairwise distances estimated using the Maximum Composite Likelihood (MCL) approach and then selecting the topology with superior log likelihood value. The tree is drawn to scale, with branch lengths measured in the number of substitutions per site. The analysis involved three nucleotide sequences. There were a total of 29 693 positions in the final dataset. All MSA of used sequences was curated by using Gblocks, and evolutionary analyses were conducted in MEGA7. MSA indicates Multiple Sequence Alignments, UPGMA, Unweighted Pair Group Method with Arithmetic Mean.
Figure 3.
Figure 3.
Molecular phylogenetic analysis of MERS-CoV, SARS-CoV, and NeoCoV genomes. The timetree shown was generated using the RelTime method. Divergence times for all branching points in the topology were calculated using the Maximum-Likelihood method based on the Tamura-Nei model. (A) The estimated log likelihood value of the topology shown is 135 729.24. The tree is drawn to scale, with branch lengths measured in the relative number of substitutions per site. The analysis involved 4 nucleotide sequences. There were a total of 30 738 positions in the final dataset. (B) The estimated log likelihood value of the topology shown is 79 370.24. The tree is drawn to scale, with branch lengths measured in the relative number of substitutions per site. The analysis involved 4 nucleotide sequences. There were a total of 22 620 positions in the final dataset. Evolutionary analyses were conducted in MEGA7. (A) Without MSA curation. (B) With MSA curation. MSA indicates Multiple Sequence Alignments.
Figure 4.
Figure 4.
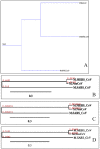
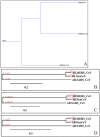
Phylogenetic of “E” proteins of target coronaviruses (MERS-CoV, SARS-CoV, and NeoCoV). Trees (A)-(D) were built using different methods, and they are, respectively, Maximum Parsimony, Neighbor-Joining, UPGMA, and Maximum-Likelihood. UPGMA indicates Unweighted Pair Group Method with Arithmetic Mean.
Figure 5.
Figure 5.
Molecular phylogenetic tree of target coronaviruses “E” proteins by Maximum-Likelihood method (timetree). The timetree shown was generated using the RelTime method. Divergence times for all branching points in the topology were calculated using the Maximum-Likelihood method based on the Equal Input model. The estimated log likelihood value of the topology shown is −703.32. The tree is drawn to scale, with branch lengths measured in the relative number of substitutions per site. The analysis involved 4 amino acid sequences. There were a total of 86 positions in the final dataset. Evolutionary analyses were conducted in MEGA7.
Figure 6.
Figure 6.
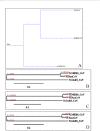
Shows phylogenetics of “M” proteins of target coronaviruses (MERS-CoV, SARS-CoV, and NeoCoV). Trees “A-D” were built using different methods, and they are, respectively, Maximum Parsimony, Neighbor-Joining, UPGMA, and Maximum Likelihood. UPGMA, Unweighted Pair Group Method with Arithmetic Mean.
Figure 7.
Figure 7.
Molecular phylogenetic analysis by Maximum-Likelihood method (timetree). The timetree shown was generated using the RelTime method. Divergence times for all branching points in the topology were calculated using the Maximum-Likelihood method based on the Equal Input model. The estimated log likelihood value of the topology shown is −1802.98. The tree is drawn to scale, with branch lengths measured in the relative number of substitutions per site. The analysis involved 4 amino acid sequences. There were a total of 244 positions in the final dataset. Evolutionary analyses were conducted in MEGA7.
Figure 8.
Figure 8.
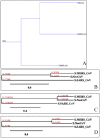
Phylogenetic of “N” proteins of target coronaviruses (MERS-CoV, SARS-CoV, and NeoCoV). Trees (A)-(D) were built using different methods, and they are, respectively, Maximum Parsimony, Neighbor-Joining, UPGMA, and Maximum Likelihood. UPGMA indicates Unweighted Pair Group Method with Arithmetic Mean.
Figure 9.
Figure 9.
Molecular phylogenetic analysis by Maximum-Likelihood method (timetree). The timetree shown was generated using the RelTime method. Divergence times for all branching points in the topology were calculated using the Maximum-Likelihood method based on the Equal Input model. The estimated log likelihood value of the topology shown is −3425.67. The tree is drawn to scale, with branch lengths measured in the relative number of substitutions per site. The analysis involved 4 amino acid sequences. There were a total of 460 positions in the final dataset. Evolutionary analyses were conducted in MEGA7.
Figure 10.
Figure 10.
Shows phylogenetic of “S” proteins of target coronaviruses (MERS-CoV, SARS-CoV, and NeoCoV). Trees (A)-(D) were built using different methods, and they are, respectively, Maximum Parsimony, Neighbor-Joining, UPGMA, and Maximum Likelihood. UPGMA indicates Unweighted Pair Group Method with Arithmetic Mean.
Figure 11.
Figure 11.
Molecular phylogenetic analysis by Maximum-Likelihood method (timetree). The timetree shown was generated using the RelTime method. Divergence times for all branching points in the topology were calculated using the Maximum-Likelihood method based on the Equal Input model. The estimated log likelihood value of the topology shown is −13 052.98. The tree is drawn to scale, with branch lengths measured in the relative number of substitutions per site. The analysis involved 4 amino acid sequences. There were a total of 1544 positions in the final dataset. Evolutionary analyses were conducted in MEGA7.
Figure 12.
Figure 12.
Shows phylogenetic of “1A” proteins of target coronaviruses (MERS-CoV, SARS-CoV, and NeoCoV). Trees (A)-(D) were built using different methods, and they are, respectively, Maximum Parsimony, Neighbor-Joining, UPGMA, and Maximum Likelihood. UPGMA indicates Unweighted Pair Group Method with Arithmetic Mean.
Figure 13.
Figure 13.
Molecular phylogenetic analysis by Maximum-Likelihood method (timetree). The timetree shown was generated using the RelTime method. Divergence times for all branching points in the topology were calculated using the Maximum-Likelihood method based on the Equal Input model. The estimated log likelihood value of the topology shown is −38 685.85. The tree is drawn to scale, with branch lengths measured in the relative number of substitutions per site. The analysis involved 4 amino acid sequences. There were a total of 4988 positions in the final dataset. Evolutionary analyses were conducted in MEGA7.
Figure 14.
Figure 14.
Phylogenetic of “1AB” proteins of target coronaviruses (MERS-CoV, SARS-CoV, and NeoCoV). Trees (A)-(D) were built using different methods, and they are, respectively, Maximum Parsimony, Neighbor-Joining, UPGMA, and Maximum Likelihood. UPGMA indicates Unweighted Pair Group Method with Arithmetic Mean.
Figure 15.
Figure 15.
Molecular phylogenetic analysis by Maximum-Likelihood method (timetree). The timetree shown was generated using the RelTime method. Divergence times for all branching points in the topology were calculated using the Maximum-Likelihood method based on the Equal Input model. The estimated log likelihood value of the topology shown is −59 576.47. The tree is drawn to scale, with branch lengths measured in the relative number of substitutions per site. The analysis involved 4 amino acid sequences. There were a total of 8041 positions in the final dataset. Evolutionary analyses were conducted in MEGA7.
Figure 16.
Figure 16.
Percent of secondary structure component of E proteins. Blue color for alpha helix, brown for extended strand, and green color for the random coil.
Figure 17.
Figure 17.
Percent of secondary structure component of M proteins. Blue color for alpha helix, brown for extended strand, and green color for the random coil.
Figure 18.
Figure 18.
Percent of secondary structure component of N proteins. Blue color for alpha helix, brown for extended strand, and green color for the random coil.
Figure 19.
Figure 19.
Percent of secondary structure component of S proteins. Blue color for alpha helix, brown for extended strand, and green color for the random coil.
Figure 20.
Figure 20.
Percent of secondary structure component of ORF1a proteins. Blue color for alpha helix, brown for extended strand, and green color for the random coil.
Figure 21.
Figure 21.
Percent of secondary structure component of ORF1ab proteins. Blue color for alpha helix, brown for extended strand, and green color for the random coil.
Figure 22.
Figure 22.
Three-dimensional (3D) structures of “E” proteins of 3 coronaviruses (MERS-CoV, SARS-CoV, and NeoCoV).
Figure 23.
Figure 23.
Three-dimensional (3D) structures of “M” proteins of 3 coronaviruses (MERS-CoV, SARS-CoV, and NeoCoV).
Figure 24.
Figure 24.
Three-dimensional (3D) structures of “N” proteins of 3 coronaviruses (MERS-CoV, SARS-CoV, and NeoCoV).
Figure 25.
Figure 25.
Three-dimensional (3D) structures of “S” proteins of 3 coronaviruses (MERS-CoV, SARS-CoV, and NeoCoV).

Similar articles

Cited by

References

    1. Agnihothram S, Gopal R, Yount BL, et al. Evaluation of serologic and antigenic relationships between Middle Eastern respiratory syndrome coronavirus and other coronaviruses to develop vaccine platforms for the rapid response to emerging coronaviruses. J Infect Dis. 2014;209:995-1006. - PMC - PubMed
    1. McBride R, van Zyl M, Fielding BC. The coronavirus nucleocapsid is a multifunctional protein. Viruses. 2014;6:2991-3018. - PMC - PubMed
    1. Hu B, Ge X, Wang LF, Shi Z. Bat origin of human coronaviruses. Virol J. 2015;22:221. - PMC - PubMed
    1. The International Committee for Taxonomy of Viruses (ICTV). http://talk.ictvonline.org/files/ictv_documents/m/msl/4090.aspx. Accessed June 27, 2014.
    1. Jain A, Mittal N, Sharma PC. Genome wide survey of microsatellites in ssDNA viruses infecting vertebrates. Gene. 2014;552:209-218. - PubMed