Improving Computer-Aided Detection Using Convolutional Neural Networks and Random View Aggregation
- PMID: 26441412
- PMCID: PMC7340334
- DOI: 10.1109/TMI.2015.2482920
Improving Computer-Aided Detection Using Convolutional Neural Networks and Random View Aggregation
Abstract
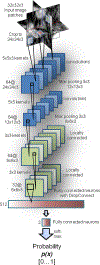
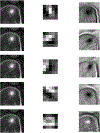
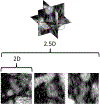
Automated computer-aided detection (CADe) has been an important tool in clinical practice and research. State-of-the-art methods often show high sensitivities at the cost of high false-positives (FP) per patient rates. We design a two-tiered coarse-to-fine cascade framework that first operates a candidate generation system at sensitivities ∼ 100% of but at high FP levels. By leveraging existing CADe systems, coordinates of regions or volumes of interest (ROI or VOI) are generated and function as input for a second tier, which is our focus in this study. In this second stage, we generate 2D (two-dimensional) or 2.5D views via sampling through scale transformations, random translations and rotations. These random views are used to train deep convolutional neural network (ConvNet) classifiers. In testing, the ConvNets assign class (e.g., lesion, pathology) probabilities for a new set of random views that are then averaged to compute a final per-candidate classification probability. This second tier behaves as a highly selective process to reject difficult false positives while preserving high sensitivities. The methods are evaluated on three data sets: 59 patients for sclerotic metastasis detection, 176 patients for lymph node detection, and 1,186 patients for colonic polyp detection. Experimental results show the ability of ConvNets to generalize well to different medical imaging CADe applications and scale elegantly to various data sets. Our proposed methods improve performance markedly in all cases. Sensitivities improved from 57% to 70%, 43% to 77%, and 58% to 75% at 3 FPs per patient for sclerotic metastases, lymph nodes and colonic polyps, respectively.
Figures


Similar articles
-
A new 2.5D representation for lymph node detection using random sets of deep convolutional neural network observations.Med Image Comput Comput Assist Interv. 2014;17(Pt 1):520-7. doi: 10.1007/978-3-319-10404-1_65. Med Image Comput Comput Assist Interv. 2014. PMID: 25333158 Free PMC article.
-
Lymph node detection in CT scans using modified U-Net with residual learning and 3D deep network.Int J Comput Assist Radiol Surg. 2023 Apr;18(4):723-732. doi: 10.1007/s11548-022-02822-w. Epub 2023 Jan 11. Int J Comput Assist Radiol Surg. 2023. PMID: 36630071
-
Computer-aided tumor detection in automated breast ultrasound using a 3-D convolutional neural network.Comput Methods Programs Biomed. 2020 Jul;190:105360. doi: 10.1016/j.cmpb.2020.105360. Epub 2020 Jan 25. Comput Methods Programs Biomed. 2020. PMID: 32007838
-
Mixture of expert 3D massive-training ANNs for reduction of multiple types of false positives in CAD for detection of polyps in CT colonography.Med Phys. 2008 Feb;35(2):694-703. doi: 10.1118/1.2829870. Med Phys. 2008. PMID: 18383691
-
Computer-Aided Detection False Positives in Colonoscopy.Diagnostics (Basel). 2021 Jun 18;11(6):1113. doi: 10.3390/diagnostics11061113. Diagnostics (Basel). 2021. PMID: 34207226 Free PMC article. Review.
Cited by
-
A Survey on Explainable Artificial Intelligence (XAI) Techniques for Visualizing Deep Learning Models in Medical Imaging.J Imaging. 2024 Sep 25;10(10):239. doi: 10.3390/jimaging10100239. J Imaging. 2024. PMID: 39452402 Free PMC article.
-
Towards automated organs at risk and target volumes contouring: Defining precision radiation therapy in the modern era.J Natl Cancer Cent. 2022 Oct 11;2(4):306-313. doi: 10.1016/j.jncc.2022.09.003. eCollection 2022 Dec. J Natl Cancer Cent. 2022. PMID: 39036546 Free PMC article. Review.
-
EMPT: a sparsity Transformer for EEG-based motor imagery recognition.Front Neurosci. 2024 Apr 18;18:1366294. doi: 10.3389/fnins.2024.1366294. eCollection 2024. Front Neurosci. 2024. PMID: 38721049 Free PMC article.
-
Designing a Hybrid Method of Artificial Neural Network and Particle Swarm Optimization to Diagnosis Polyps from Colorectal CT Images.Int J Prev Med. 2024 Jan 31;15:4. doi: 10.4103/ijpvm.ijpvm_373_22. eCollection 2024. Int J Prev Med. 2024. PMID: 38487703 Free PMC article.
-
An Improved Nested U-Net Network for Fluorescence In Situ Hybridization Cell Image Segmentation.Sensors (Basel). 2024 Jan 31;24(3):928. doi: 10.3390/s24030928. Sensors (Basel). 2024. PMID: 38339644 Free PMC article.
References
-
- W. H. Organization, Cancer Fact shee N297. WHO, 2014.
-
- Msaouel P, Pissimissis N, Halapas A, and Koutsilieris M, “Mechanisms of bone metastasis in prostate cancer: clinical implications,” Best Practice & Research Clinical Endocrinology & Metabolism, vol. 22, no. 2, pp. 341–355, 2008. - PubMed
-
- Wiese T, Yao J, Burns JE, and Summers RM, “Detection of sclerotic bone metastases in the spine using watershed algorithm and graph cut,” in SPIE Med. Imag, pp. 831512–831512, 2012.
MeSH terms
Grants and funding
LinkOut - more resources
Full Text Sources
Other Literature Sources
Miscellaneous

